

 Return to
 How to Use CRM Advanced Reports for Data-Driven Decisions

Modern organizations thrive by transforming raw data into strategic direction. Today’s specialized analytics tools, like ClearCRM, empower teams to build custom dashboards that uncover patterns in customer interactions, sales trends, and operational efficiency. By combining SQL-powered queries with dynamic formatting, these platforms unlock deeper insights than traditional methods.
Three core components make this possible: custom query builders for precise data extraction, visual formatting modules to clarify complex datasets, and automated delivery systems to keep stakeholders informed. This approach eliminates reliance on rigid templates, giving teams full control over the metrics they monitor.
Organizations using these solutions often identify revenue opportunities faster. For example, a retail chain might analyze regional buying habits to optimize inventory, while a service provider may track support ticket resolution rates to boost client satisfaction. The common thread? Actionable intelligence replaces guesswork.
While these tools require some technical proficiency, the benefits are significant. Teams gain real-time visibility into performance metrics across departments. Decision-makers access unified dashboards rather than patching together fragmented spreadsheets. This enables faster, smarter responses to market changes and customer needs.
Key Takeaways
- Custom analytics systems convert unstructured data into clear operational guidance
- SQL-based queries allow precise targeting of specific business metrics
- Automated reporting ensures timely delivery of critical insights
- Cross-departmental dashboards eliminate data silos
- Real-time analysis supports agile responses to market changes
Introduction to CRM Advanced Reports
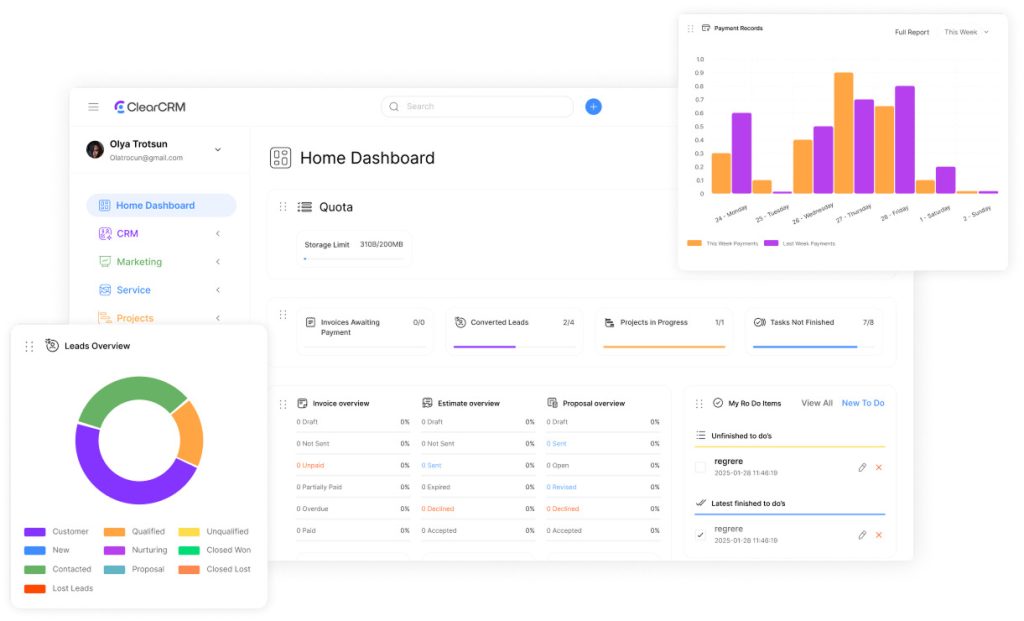
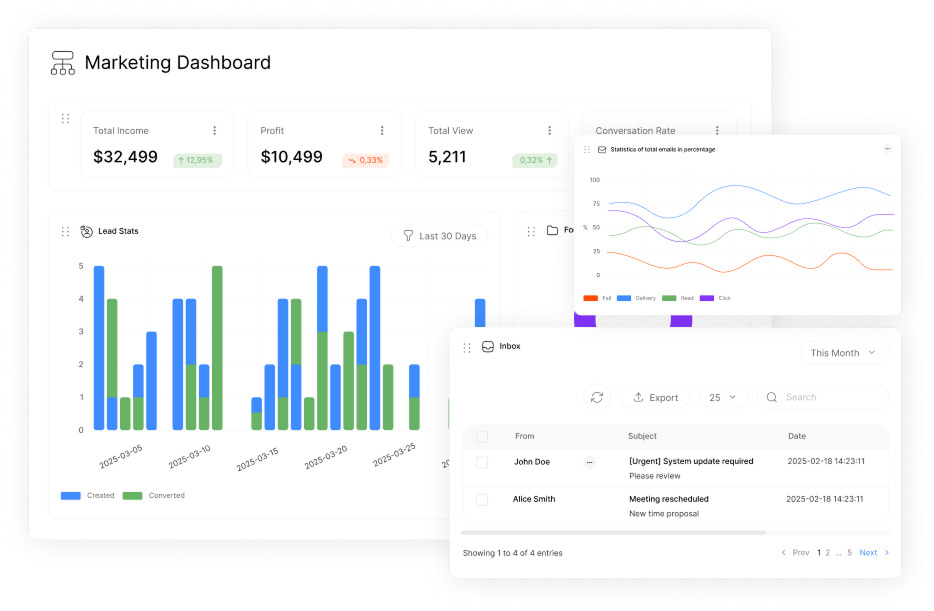
In today’s information-driven environment, tailored reporting solutions help uncover hidden opportunities. These systems go beyond static spreadsheets by offering dynamic ways to examine operational patterns and customer behaviors. Managers gain granular visibility into pipelines, team performance, and market trends through interactive dashboards.
Overview of Capabilities
Sophisticated analytics platforms identify revenue bottlenecks. Custom filters allow teams to isolate variables like regional sales performance or seasonal demand shifts. As one retail operations director puts it: “You can’t fix what you don’t measure.” Comparison charts help visualize how product lines perform across demographics, enabling smarter decisions.
Key Benefits for Data-Driven Strategies
These tools turn raw metrics into targeted improvement plans. A service company might discover 40% of support delays originate from two understaffed regions. Unified dashboards merge data from marketing, sales, and support teams, breaking down departmental silos. This clarity helps leaders reallocate resources where they’ll have maximum impact.
Businesses using these solutions report faster response times to market changes. Real-time alerts about sudden drops in conversion rates or spikes in customer complaints let teams course-correct immediately. The result? Proactive strategy adjustments replace reactive firefighting.
Getting Started with Advanced Reports
To use advanced analytics effectively, teams must understand the platform’s tools and access protocols. For instance, SugarCRM centralizes reporting features in a user-friendly interface with clear navigation and role-based controls.
Navigating the Reports Module
Teams locate the three-dots menu in the reports tab, selecting “Manage Advanced Reports” to begin. The Actions menu provides shortcuts for building new queries or formatting data outputs. Recent reports appear upfront, letting users quickly revisit previous analyses without digging through menus.
Customization options group related functions, like query builders and visualization tools, in logical clusters. “The interface reduces training time by 30%,” observes a retail analytics manager. Dropdown lists simplify filtering by date ranges, regions, or performance metrics.
User Roles and Access Permissions
Administrators handle complex setups requiring SQL knowledge, while standard users view outputs tied to their team’s data. Permission structures act as gatekeepers, ensuring sensitive figures stay protected. Security protocols automatically restrict access to unauthorized personnel, even if reports contain multiple data sources.
Managers configure visibility rules so sales teams see client pipelines but not financial projections. Audit logs track who viewed or modified each report, adding accountability. This layered approach maintains flexibility without compromising data integrity.
Creating Custom Queries for Data Extraction
Precision in data extraction starts with well-designed SQL commands tailored to specific business needs. Teams construct queries that pinpoint critical metrics like sales patterns or customer engagement trends. This approach transforms raw information into targeted insights for informed decision-making.
Building SQL Queries for Your Report
Effective queries begin by selecting the right fields from database tables. Users input SQL statements into the designated query builder, naming each extraction process for easy reference. A logistics manager might track shipment delays by pulling delivery timelines and regional performance data.
The system requires clear description fields to document each query’s purpose. Teams toggle edit locks to prevent accidental changes to mission-critical extractions. “Descriptive names save hours during quarterly reviews,” notes a financial analyst. Role-based access ensures only authorized users modify sensitive queries.
Verifying Query Accuracy and Validity
Syntax checks run automatically when saving new queries. Invalid statements trigger error messages highlighting missing clauses or incorrect table name references. This prevents flawed extractions from skewing report outputs.
Validation processes examine joins between tables to maintain data integrity. Teams receive warnings if queries strain system resources, allowing optimization before finalizing. These safeguards ensure every extraction delivers reliable results for strategic analysis.
Well-structured queries become reusable assets across departments. Marketing might adapt a sales team’s customer segmentation logic to identify new campaign opportunities. This cross-functional efficiency turns complex data into actionable organizational knowledge.
Designing Data Formats for Your Reports
Visual clarity transforms raw numbers into actionable insights. Effective data presentation requires meticulous formatting choices that align with organizational goals. Teams configure layout elements to highlight trends and relationships within complex datasets, ensuring stakeholders grasp key takeaways at a glance.
Customizing Table Appearance and Layout
Formatting fields like background colors and font sizes let teams create polished outputs. For example, alternating row shades improve readability in dense tables. A logistics director noted: “Blue header backgrounds reduced spreadsheet review time by 15% during audits.”
| Formatting Field | Purpose | Impact |
|---|---|---|
| Body Background Color | Differentiate data sections | Reduces visual fatigue |
| Header Text Color | Emphasize column labels | Accelerates data scanning |
| Table Width % | Adapt layouts for screens | Optimizes mobile viewing |
| Exportable (CSV) | Enable external analysis | Simplifies cross-team sharing |
Export options maintain data integrity when transferring figures to external tools. Font size adjustments ensure printed reports remain legible during executive reviews. Teams reuse approved color schemes across departments to reinforce brand consistency.
Layout controls like adjustable column widths help present multiple data types in single views. These features eliminate manual reformatting when sharing insights through emails or presentations. The result? Decision-makers spend less time deciphering spreadsheets and more time acting on trends.
Linking Data Formats to CRM Advanced Reports
Effective analysis requires merging structured queries with visual presentation. By connecting custom data formats to reports, teams create unified dashboards that tell complete stories. This integration lets decision-makers compare trends, track performance, and identify patterns across diverse metrics.
Relating Custom Queries with Data Formats
Each data format acts as a lens, shaping how extracted information appears in final outputs. Users pair SQL queries with formatting rules to highlight key figures like sales fluctuations or customer engagement rates. For example, a “regional revenue” query might use color-coded tables to spotlight top-performing markets.
| Action | Function | Outcome |
|---|---|---|
| Select | Link formats to reports | Build layered views |
| Up/Down | Reorder sections | Prioritize critical data |
| Edit | Adjust formatting rules | Maintain visual clarity |
| Delete | Remove outdated formats | Prevent clutter |
Stacked tables let teams display multiple data sets in one view without overwhelming readers. A financial report might show quarterly earnings above expense breakdowns, connected through shared date ranges. Positioning controls ensure the most urgent metrics appear first.
The system prevents format duplication across reports through relationship checks. Users reuse queries with different visual styles for varied audiences—executives get summary tables, while analysts see raw figures. “We tailor reports in minutes instead of rebuilding them,” explains a retail operations lead.
Edits to formats don’t alter the original query logic, preserving data accuracy. Teams test layouts using preview modes before publishing, ensuring consistency across devices. This approach turns complex datasets into clear, actionable narratives.
Interlocking Parent/Child Queries for In-Depth Analysis
Hierarchical analysis transforms how teams explore complex datasets. By linking related queries, organizations create layered views that connect high-level summaries with granular details. This approach reveals patterns hidden in standalone reports.
Building Multi-Level Data Relationships
Parent-child structures work like nesting dolls. The system first processes the parent query to generate primary results. For each row in these results, it triggers a child query using dynamic substitution parameters. A sales team might pair a user list (parent) with individual deal pipelines (child).
| Aspect | Parent Query | Child Query |
|---|---|---|
| Purpose | Identify user accounts | Show assigned accounts |
| Execution Order | Runs first | Triggers per parent row |
| Parameter Syntax | N/A | {sub}id{sub} |
| Output Type | Summary data | Drill-down details |
The {sub}id{sub} placeholder automatically inserts values from parent results. This creates precise filters without manual adjustments. “Our regional managers now see customer portfolios alongside sales figures,” shares a retail operations lead.
Two-level nesting balances depth with system performance. While deeper hierarchies exist in other tools, this limitation ensures fast processing. Teams maintain clarity by focusing on essential parent-child relationships rather than endless subcategories.
Permission controls extend to multi-level queries. Marketing analysts might access campaign performance summaries but not individual lead contact details. These safeguards prevent data overload while preserving critical insights.
Leveraging Advanced Reporting Tools for CRM Analytics

Sales teams achieve peak performance when they transform information into clear directives. Specialized tools analyze patterns across customer interactions and revenue streams, revealing hidden opportunities. By filtering datasets through multiple lenses, organizations pinpoint exactly where to focus growth efforts.
Turning Metrics Into Strategic Moves
Effective analysis starts with examining time-bound trends. A six-month pipeline review might compare new client acquisition against recurring revenue streams. Monthly breakdowns show whether teams meet quarterly targets or need course corrections.
Key metrics like conversion rates and deal velocity emerge through layered filters. Teams exclude outdated or irrelevant entries to sharpen focus. “We spotted a 22% uplift in high-value clients after refining our filters,” shares a tech sales director.
| Metric | Analysis Focus | Business Impact |
|---|---|---|
| Lead Source ROI | Marketing channel efficiency | Budget optimization |
| Deal Stage Duration | Sales process bottlenecks | Faster closings |
| Product Performance | Category popularity | Inventory planning |
Comparative views highlight regional disparities or team skill gaps. Managers identify top performers’ strategies through side-by-side data displays. This drives targeted coaching rather than blanket training programs.
Forecasting tools predict revenue shifts using historical patterns and current pipelines. Teams adjust quotas or staffing months before crunch periods. The result? Proactive planning replaces last-minute scrambles.
Implementing Data Filters and Saved Views
Effective data analysis hinges on precise filtering. Teams isolate critical trends by focusing on specific time frames or performance categories. This approach turns overwhelming datasets into targeted insights.
Applying Date and Comparison Filters
Date filters let users examine monthly or quarterly patterns without manual calculations. A sales manager might compare Q3 lead conversions against Q2 results to gauge campaign effectiveness. Real-time updates ensure reports reflect current conditions.
Comparison tools group information by team members, product lines, or regions. These side-by-side views expose disparities in performance metrics. For example, filtering by sales rep reveals top performers’ strategies for replication.
Maximizing Customization with Saved Views
Saved views act as reusable templates that automatically apply filters. Teams track inactive leads or stalled deals using preconfigured criteria. A marketing director noted: “We identify untapped opportunities in three clicks instead of rebuilding reports.”
These views maintain consistency across departments while allowing personal tweaks. Custom date ranges align with fiscal calendars, ensuring relevance for strategic planning. Businesses using top CRM solutions report 27% faster decision-making through this feature.