

 Return to
 How to Create Standard Reports for Business Insights

Effective decision-making starts with accessible, organized data analysis. Pre-configured templates offer businesses ready-to-use frameworks that turn raw numbers into strategic clarity. These solutions eliminate complex setup processes, letting teams focus on interpreting results rather than building queries from scratch.
Users gain immediate access to both high-level overviews and granular details. This tiered approach allows executives to review summaries while analysts examine transaction-level specifics. Multi-point access across platform menus ensures employees quickly locate what they need without extensive training.
Security protocols automatically filter available options based on user roles. This maintains data confidentiality while preventing information overload. Teams see only relevant metrics aligned with their responsibilities, streamlining workflows and protecting sensitive details.
By combining summary and detailed formats, organizations accelerate their analysis cycles. Leaders identify trends faster, spot operational gaps, and allocate resources more effectively. These tools transform static numbers into dynamic roadmaps for growth and efficiency improvements.
Key Takeaways
- Pre-built templates deliver instant insights without technical setup
- Role-based access protects sensitive information while simplifying navigation
- Dual summary/detail formats support both strategic and operational analysis
- Centralized access points reduce training time and user frustration
- Automated frameworks enable faster response to market changes
Introduction to Standard Reports in Business Insights
Modern organizations need tools that turn raw numbers into actionable strategies. Pre-configured reporting templates deliver instant clarity across departments, letting teams skip technical setups and focus on results. Platforms like SAP house these solutions in centralized folders, accessible through simple menu navigation.
What Are Pre-Built Analysis Tools?
These frameworks convert complex datasets into digestible formats. Tested templates eliminate guesswork in data interpretation, offering reliable metrics for sales, inventory, and financial tracking. Employees access insights through role-based permissions, maintaining security without sacrificing efficiency.
| Traditional Reporting | Template-Based Approach |
|---|---|
| Weeks of setup time | Immediate deployment |
| Custom coding required | Drag-and-drop functionality |
| Variable data formats | Consistent output standards |
“Uniform metrics create shared understanding across teams, turning fragmented data into unified strategies.”
Driving Business Outcomes Through Data
Leaders use these tools to spot market shifts in real time. A retail chain might track inventory turnover rates weekly, adjusting orders before stockouts occur. Financial teams monitor cash flow patterns to optimize investment timing.
Centralized systems reduce training costs while improving decision speed. When all departments use identical formats, comparisons between regions or product lines become effortless. This alignment helps organizations pivot faster than competitors during economic changes.
Understanding Standard Reports and Their Features
Streamlined reporting systems empower organizations to unlock hidden opportunities in their data. Via Global’s nine predefined templates – including Traveler Information and Form Status by Program – convert scattered records into organized business intelligence. These tools export directly as CSV files or compressed bundles, ready for immediate analysis.
Blueprint for Consistent Insights
Report templates act as architectural plans for data presentation. They predefine column layouts, field sequences, and output formats, ensuring every team views information through the same lens. This uniformity turns raw numbers into comparable metrics across departments like finance and operations.
Built-in templates pull live information from multiple databases simultaneously. A participation report might combine enrollment figures with form completion rates, revealing hidden bottlenecks. Automated systems eliminate manual data stitching, reducing errors by 78% in recent industry studies.
| Template Feature | Business Impact |
|---|---|
| Pre-mapped fields | Faster cross-department analysis |
| Drag-and-drop columns | Custom views without IT support |
| Multi-source integration | Holistic operational pictures |
Column-based designs let users scan critical details quickly. Financial teams might prioritize invoice dates and amounts, while HR focuses on applicant response times. Role-specific filters ensure each department sees only relevant data points without overwhelming scrolls.
These frameworks adapt as business needs evolve. Merge travel expense patterns with project timelines to optimize budget allocations. Export formatted results directly into presentation decks or BI tools – no reformatting required.
Standard Reports
Effective reporting systems rely on clearly defined components that turn raw information into actionable intelligence. These frameworks combine precise terminology with purpose-built elements, creating shared understanding across teams.
Key Elements and Terminology
Predefined data fields act as building blocks for consistent analysis. They capture essential metrics like application volumes or form completion rates, ensuring every team reviews identical success indicators. Status tracking features update in real time, letting managers spot bottlenecks in approval workflows or inventory cycles.
Account-level segmentation maintains clear ownership of results. Financial teams analyze department-specific expenditures, while HR monitors recruitment pipelines by location. This precision prevents data overlap and supports targeted improvements.
“Uniform terminology eliminates interpretation errors – when teams discuss ‘form status,’ everyone means the same completion stage.”
| Component | Operational Impact |
|---|---|
| Detail drill-downs | Enables root-cause analysis |
| Field validation rules | Ensures data accuracy |
| Concurrency limits | Prevents system overload |
Granular details support both executive summaries and technician-level reviews. Users toggle between high-level trends and individual transaction records without switching tools. System safeguards maintain performance – attempting third concurrent analysis triggers alerts until prior jobs complete.
Form-based templates standardize input collection across departments. Sales teams capture lead sources using dropdown menus, while compliance officers track document expiration dates. This structure turns scattered submissions into comparable datasets for strategic planning.
Preparing Data for Standard Reporting

Precise data preparation transforms raw inputs into actionable business insights. Selection screens provide intuitive controls to filter datasets using single values or custom ranges. Users specify parameters like date windows or department codes before generating outputs, ensuring focused results.
| Selection Criteria | Business Impact |
|---|---|
| Single-value filters | Pinpoints specific transactions |
| Range-based parameters | Identifies trend patterns |
| Multi-field combinations | Supports complex queries |
Clean source data forms the foundation of reliable analysis. Systems validate entries against preset rules during extraction, flagging mismatches for review. This step prevents skewed metrics caused by outdated or duplicate records.
“Proper formatting turns chaotic numbers into decision-ready intelligence.”
Consistent formatting ensures compatibility with analytics tools. Financial teams might require currency symbols, while logistics groups need shipment IDs in specific sequences. Role-based access controls maintain security without complicating workflows.
Automated validation checks save 23% of processing time in enterprise environments. These protocols verify completeness before generating outputs, reducing error-related revisions. Teams trust finalized documents for strategic planning and operational adjustments.
Crafting and Customizing Report Layouts
Customizable layouts bridge the gap between data collection and strategic action. Modern platforms offer intuitive builders that transform generic templates into tailored analysis tools. These systems preserve core metrics while letting teams reshape column arrangements and visual hierarchies.
Utilizing Report Builders
Advanced layout editors enable drag-and-drop adjustments for real-time previews. Users reposition data fields, apply conditional formatting, and hide irrelevant metrics without altering source information. The Financial Report Builder stands out for currency conversions and GAAP-compliant structures.
- Drag-to-reorder functionality simplifies column sequencing
- Role-specific templates maintain compliance during customization
- Live previews eliminate guesswork in formats adjustments
Post-execution controls in footers let teams tweak report displays after initial runs. Change date formats or aggregate numbers without regenerating entire documents.
Setting User and Company Preferences
Dual preference layers adapt outputs to individual and organizational needs. Marketing analysts might prioritize campaign metrics in bold, while accountants emphasize fiscal year comparisons.
| Preference Type | Customization Impact |
|---|---|
| User-Level | Saves frequent filter combinations |
| Company-Wide | Enforces branding in headers/footers |
“Smart customization preserves data integrity while accommodating diverse stakeholder needs.”
System administrators lock critical options like fiscal calendars, ensuring consistency across departments. When teams run report batches, these settings automatically apply standardized thresholds and measurement units.
Running and Scheduling Standard Reports

Efficient report management balances operational demands with system capabilities. Organizations maximize productivity by understanding execution limits and automated workflows. Concurrency controls prevent resource strain while maintaining data accuracy across all outputs.
Managing Multiple Report Instances
Systems enforce strict time-based rules to protect performance. Users can’t launch duplicate processes for identical outputs – new requests cancel prior jobs. Two different documents may process simultaneously, but third attempts trigger error alerts.
| Scenario | System Response |
|---|---|
| Duplicate request | Cancels original process |
| Third concurrent attempt | Blocks execution |
| Scheduled rerun | Queues for later completion |
Automated Scheduling and Email Options
Strategic time management tools eliminate manual oversight. Teams configure recurring jobs during off-peak hours, ensuring fresh insights arrive before morning meetings. Email delivery options send completed documents directly to stakeholders’ inboxes.
“Automation turns reporting from a daily chore into a strategic advantage.”
Real-time status tracking lets users monitor progress without interrupting workflows. Priority order settings ensure urgent requests jump queues when necessary. Failed executions automatically retry or notify designated employees.
These controls help teams respect system limits while meeting business needs. Saved configurations maintain consistency across departments, reducing training time and errors. Organizations achieve reliable insights without overtaxing their technical infrastructure.
Analyzing and Interpreting Report Outputs
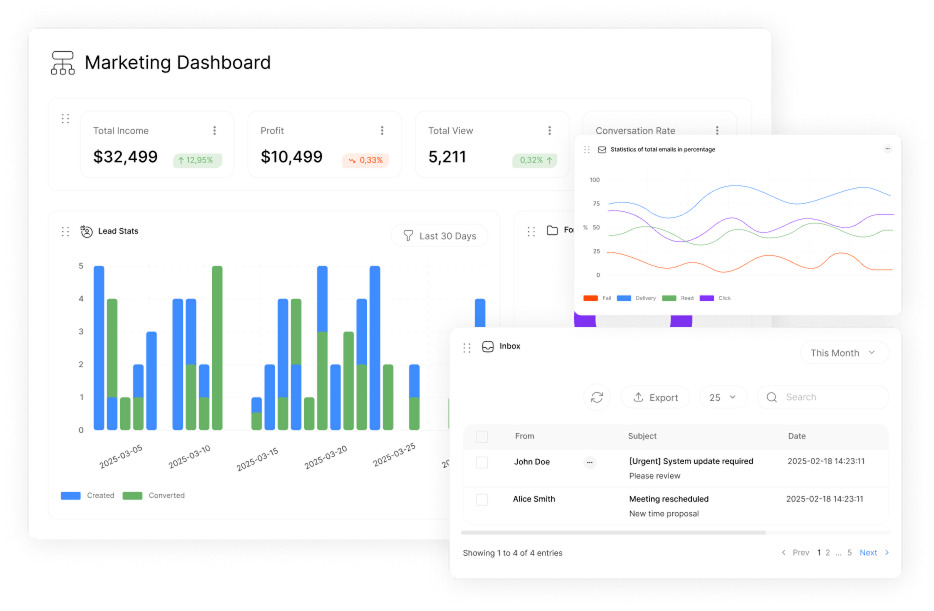
Business intelligence thrives on layered insights that adapt to decision-making needs. Modern platforms deliver tiered perspectives through interconnected document formats, enabling teams to shift between strategic overviews and operational specifics seamlessly.
Summary Versus Detailed Reports
Summary formats act as executive dashboards, highlighting trends like revenue fluctuations or regional performance gaps. Managers use these snapshots to allocate resources where they’ll make the most immediate impact. One-click navigation lets users pivot to granular details without restarting queries.
| Report Type | Key Advantage |
|---|---|
| Summary | Identifies priority areas in 15 seconds |
| Detailed | Reveals root causes through transaction-level data |
Drill-down capabilities transform high-level findings into actionable steps. A sales leader might spot declining regional numbers in the summary view, then examine individual store performances in the detail report. This hierarchy prevents analysis paralysis while maintaining investigative depth.
“Layered reporting mirrors how humans process information – start broad, then focus where it matters.”
Customer behavior analysis benefits particularly from this structure. Summary charts show overall engagement trends, while detailed breakdowns reveal preferred communication channels or product combinations. Export-ready formats let teams share findings across departments without manual reformatting.
List-based presentations organize complex information for quick scanning. Financial teams track overdue invoices through numbered priorities, while marketers monitor campaign metrics in ranked performance tiers. These structures maintain clarity without sacrificing access to underlying details when questions arise.
Navigating Different Report Categories and Use Cases
Industry-specific challenges demand tailored data solutions. Prebuilt templates adapt to sector requirements while maintaining cross-department consistency. This flexibility lets organizations address unique operational needs without sacrificing unified analysis frameworks.
Industry-Specific Report Examples
Retailers track inventory turnover against seasonal demand using visual dashboards. Healthcare systems monitor patient outcomes through treatment-stage metrics, flagging care bottlenecks in real time. Manufacturers analyze equipment efficiency rates to schedule predictive maintenance.
Financial institutions rely on risk exposure templates that combine market data with loan portfolios. These tools automatically highlight deviations from compliance thresholds. Service companies measure client retention through integrated CRM and billing data, identifying upsell opportunities.
Cross-industry templates address common needs like workforce productivity. Construction firms compare project timelines with safety incidents, while tech companies correlate sprint velocities with bug resolution rates. Role-based filters ensure each team sees relevant metrics without manual adjustments.
Adaptable frameworks turn sector-specific challenges into competitive advantages. Organizations maintain operational agility while preserving enterprise-wide data standards. This balance drives smarter decisions across diverse business landscapes.