

 Return to
 Sales Reporting And Analytics: Ultimate Guide to Insights

Every revenue-driven organization thrives on clear visibility into performance. Turning raw numbers into strategic action distinguishes industry leaders from competitors struggling to adapt. This guide delivers actionable methods to transform how teams interpret critical sales metrics.
Modern enterprises require more than spreadsheets and intuition. Structured analysis frameworks help identify patterns, forecast trends, and optimize workflows. Businesses adopting these systems often see 15-20% faster revenue growth compared to peers relying on outdated methods.
Decision-makers face pressure to act quickly while minimizing risk. Automated tools now provide real-time dashboards, eliminating delays in accessing key performance indicators. These solutions reduce operational costs while improving forecasting accuracy by up to 30%.
Common challenges like inconsistent tracking or fragmented data become manageable with proper planning. This resource outlines step-by-step processes to replace guesswork with measurable strategies, empowering teams to prioritize high-impact activities aligned with organizational goals.
Key Takeaways
- Data-driven strategies boost revenue growth by 15-20% versus traditional approaches
- Automated reporting cuts operational costs and improves forecast accuracy
- Real-time dashboards enable faster, more informed decisions
- Structured frameworks help teams identify performance patterns quickly
- Practical solutions address data fragmentation and inconsistent tracking
Introduction to Sales Reporting And Analytics
Business growth increasingly depends on translating raw figures into actionable strategies. Structured evaluation of operational metrics helps teams spot inefficiencies and opportunities hidden within daily transactions, turning fragmented data into cohesive roadmaps for revenue optimization.
The Role of Sales Data in Driving Revenue
Accurate metrics act as a strategic compass, guiding teams toward profitable decisions. Tracking lead conversion patterns helps identify bottlenecks in customer journeys. Organizations using these insights often adjust tactics 30% faster than peers relying on intuition.
Comprehensive evaluations reveal correlations between team activities and financial outcomes, clarifying which behaviors impact pipeline health and customer retention. This insight enables precise resource allocation, reducing wasted effort on low-impact tasks.
Setting the Stage for Data-Driven Success
Effective systems start with defining which metrics align with organizational priorities. A tech firm might prioritize product adoption rates, while a service provider focuses on client satisfaction scores. This alignment ensures every report supports tangible business objectives.
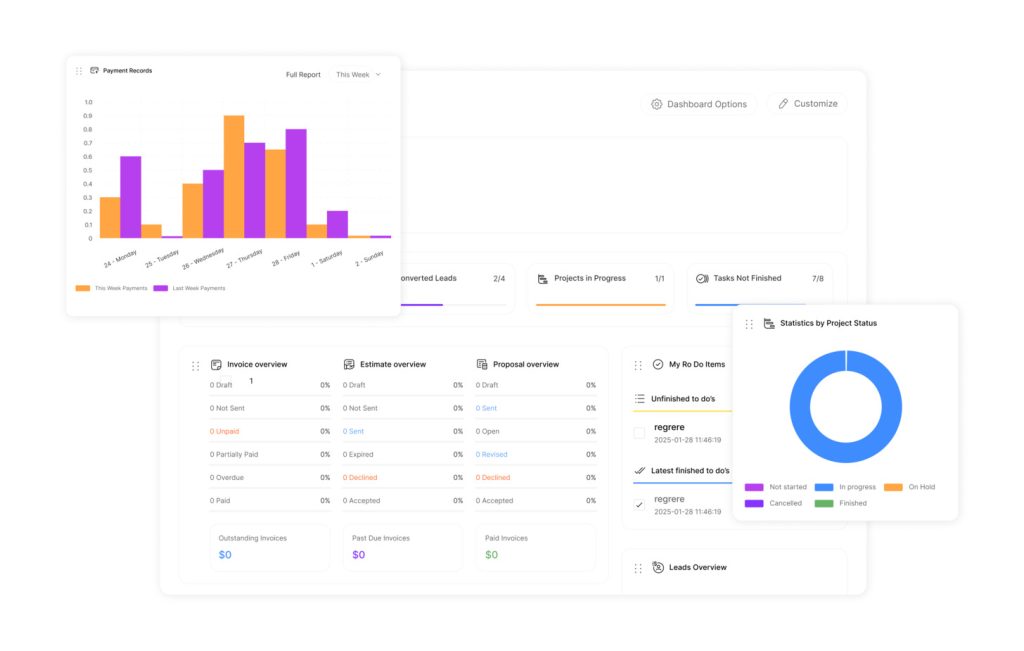
Modern platforms provide live updates on critical indicators like deal progression and inventory turnover. Decision-makers access current information without manual data compilation delays. Proactive adjustments become routine rather than reactive exceptions.
Successful implementation requires training teams to interpret findings and act decisively. When employees understand how their contributions affect broader goals, engagement and productivity rise organically.
Fundamentals of Sales Reporting Tools and Metrics
Organizations achieve measurable outcomes when combining precise measurement systems with purpose-built technology. Selecting the right mix of indicators and platforms ensures teams focus on activities that drive tangible results.
Understanding Key Metrics and KPIs
High-performing teams track leading indicators like pipeline velocity and conversion rates. These metrics predict future outcomes, allowing adjustments before quarterly targets slip. Lagging indicators, such as quarterly revenue, confirm whether past strategies worked.
Platforms like Pipedrive and HubSpot automatically monitor deal progression and team productivity. Managers identify top performers and bottlenecks through visual dashboards. This clarity helps redistribute resources to high-impact opportunities.
Leveraging CRM and BI Solutions
Modern systems merge customer data with advanced analytics. Business intelligence tools transform raw figures into trend forecasts and risk assessments. Teams spot patterns that manual reviews might miss.
| Feature | CRM Platforms | BI Tools |
|---|---|---|
| Core Function | Track interactions | Analyze trends |
| Strengths | Deal management | Predictive modeling |
| Best For | Daily operations | Strategic planning |
Integrated solutions eliminate data silos between departments. Unified dashboards display real-time updates on lead quality and inventory turnover. Decision-makers act faster when all insights reside in one accessible location.
Benefits of Effective Sales Reporting
High-performing teams thrive when equipped with systems that convert data into competitive advantages. Structured evaluation processes empower organizations to align daily activities with long-term objectives, creating measurable improvements across departments.
Boosting Team Efficiency
Visibility into individual achievements helps managers replicate winning strategies. Tools like CRM platforms highlight top contributors, enabling knowledge-sharing that elevates entire groups. This approach builds accountability while fostering mentorship opportunities.
Real-time dashboards reveal bottlenecks in workflows. Teams resolve issues before they escalate, maintaining momentum toward quarterly targets. Immediate feedback loops also encourage healthy competition, driving collective growth.
Patterns in customer behavior become actionable through detailed analysis. Organizations adjust pricing models or inventory levels based on demand trends. Proactive adjustments reduce missed opportunities and increase market responsiveness.
Key advantages include:
- Faster identification of high-value clients
- Accurate forecasts for resource planning
- Streamlined processes that accelerate deal closures
Data-driven cultures eliminate assumptions from strategic decisions. Teams focus energy on activities proven to impact revenue, achieving goals with precision. This clarity reduces wasted effort and strengthens alignment across departments.
Creating Actionable Sales Reports
Crafting impactful performance documents requires methodical planning and audience awareness. Teams transform scattered metrics into strategic roadmaps through structured frameworks that prioritize clarity over complexity.
Blueprint for Effective Documentation
Successful reports start with a clear outline. Organize data into logical sections like historical comparisons, current trends, and future projections. This structure helps readers grasp insights without sifting through irrelevant details.
| Step | Key Action | Outcome |
|---|---|---|
| 1 | Define objectives & audience | Tailored content alignment |
| 2 | Gather multi-source data | Comprehensive analysis |
| 3 | Visualize trends | Faster decision-making |
| 4 | Add context | Actionable interpretations |
| 5 | Review accuracy | Credible conclusions |
| 6 | Specify next steps | Measurable outcomes |
Identify whether readers need executive summaries or granular operational details. A VP might require profit margin trends, while regional managers focus on inventory turnover rates.
Combine CRM data with marketing campaign results to show cause-effect relationships. Charts comparing quarterly gross sales to outreach efforts reveal what drives success.
Critical elements include:
- Visual dashboards showing KPI progressions
- Year-over-year comparisons for key metrics
- Clear links between activities and results
Final reports should conclude with specific recommendations, like adjusting pricing strategies or reallocating team resources. This turns analysis into operational improvements.
Types of Sales Analysis Reports and Their Uses
Data clarity transforms operational guesswork into targeted strategies. Teams use specialized reports to pinpoint strengths, weaknesses, and opportunities across revenue cycles. These documents serve as tactical guides for optimizing workflows and resource allocation.
Pipeline and Conversion Rate Reports
Pipeline evaluations track deal progression through each stage of the buyer’s journey. They highlight stalled opportunities requiring intervention and predict short-term revenue streams. For example, a 15% drop in mid-funnel conversions might signal ineffective follow-up practices.
Conversion rate analysis reveals where prospects disengage. Teams identify bottlenecks in lead nurturing processes and adjust qualification criteria. This approach reduces wasted effort on low-potential accounts.
Forecast and Revenue Analysis
Accurate predictions combine historical trends with current pipeline metrics. Organizations allocate budgets confidently when projections account for seasonal fluctuations and market shifts. One logistics company reduced inventory waste by 22% using these insights.
| Report Type | Key Metrics | Strategic Impact |
|---|---|---|
| Pipeline Health | Deal stage duration | Identifies process inefficiencies |
| Conversion Rates | Lead-to-client ratios | Improves targeting accuracy |
| Revenue Forecasts | Historical comparisons | Guides budget decisions |
Deal analysis examines why certain opportunities succeed or fail. Patterns in client objections or pricing negotiations inform training programs. Teams replicate winning strategies while avoiding past mistakes.
Effective reports balance detail with actionable insights. Decision-makers receive concise data visualizations rather than raw spreadsheets. This approach accelerates response times during critical growth phases.
Practical Tips for Sales Process Optimization

Operational excellence requires systematic refinement of workflows. Start by mapping each stage of the sales process to identify delays or redundant steps. Teams using this approach often reduce deal cycle times by 18-25%. By leveraging technology to streamline these workflows, organizations can also enhance collaboration among team members. Implementing sales process automation benefits not only mitigate human error but also free up valuable time for sales teams to focus on high-impact activities. Ultimately, this leads to improved customer satisfaction and higher conversion rates.
Standardized procedures create consistency without stifling adaptability. A balanced framework lets teams adjust tactics for different client types while maintaining core protocols. For example, quick-response strategies prove critical – prospects contacted within five minutes convert 8x more frequently than those reached later.
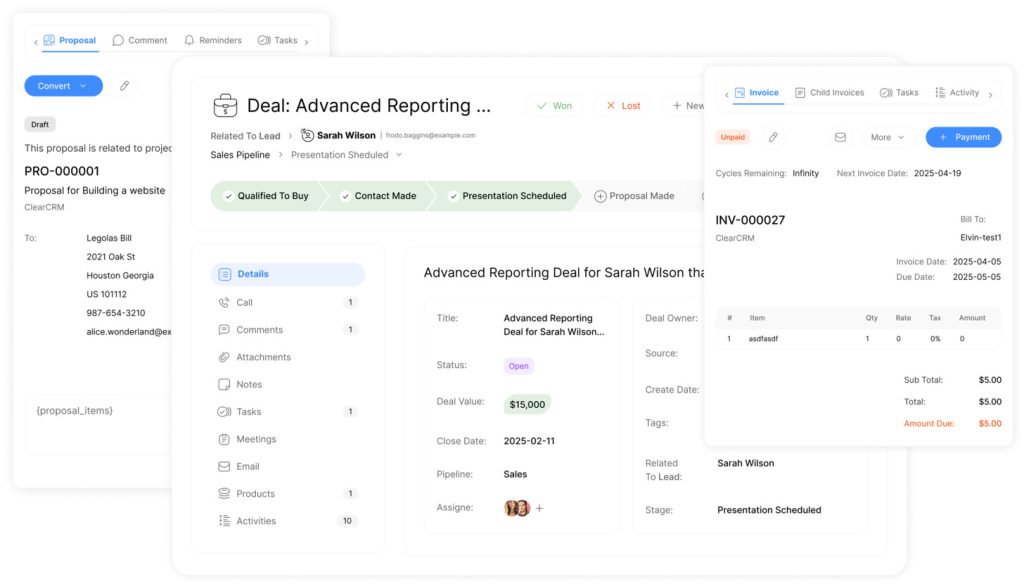
Technology integration eliminates manual bottlenecks. CRM solutions like ClearCRM automate follow-ups and data entry, freeing reps for high-value negotiations. This shift allows teams to focus on relationship-building activities that directly impact revenue.
Effective optimization relies on three pillars:
- Performance benchmarks: Track metrics like response times and conversion rates
- Continuous training: Update skills through role-play scenarios and tool workshops
- Process audits: Review workflows quarterly using rep feedback and client surveys
Time management proves crucial in sustained improvement. Analyze activity logs to reallocate efforts toward pipeline-generating tasks. Teams that prioritize strategic selling over administrative work typically see 30% higher quota attainment.
Regular data reviews maintain momentum. Compare current sales process efficiency against historical baselines to measure progress. This practice helps organizations refine tactics while preserving what works.
Overcoming Challenges in Sales Reporting

Navigating complex information landscapes requires strategic filtering. Many teams struggle with excessive metrics that obscure critical patterns. Prioritizing quality over quantity transforms reporting from overwhelming to actionable.
Cutting Through Information Noise
Excessive figures create paralysis rather than clarity. Organizations often track hundreds of metrics without understanding their relevance. Successful teams focus on 5-7 core indicators tied directly to revenue goals.
Automation solutions eliminate manual entry errors while accelerating analysis. Platforms like Power BI automatically flag anomalies in inventory turnover or lead conversion rates. This reduces time spent on data preparation by up to 60%.
Visual storytelling makes trends instantly understandable. Interactive dashboards replace static spreadsheets, highlighting relationships between marketing efforts and pipeline growth. For example, a logistics company reduced analysis time by 40% using heatmaps to show regional demand fluctuations.
Best practices include:
- Establishing standardized templates for recurring reports
- Conducting monthly audits to remove outdated metrics
- Training teams to interpret visualizations, not raw datasets
Collaborative design ensures reports address actual needs. Cross-department workshops identify which numbers influence daily decisions. This alignment prevents wasted effort on irrelevant tracking.
Advanced Sales Reporting And Analytics Best Practices
Cutting-edge organizations leverage interconnected systems to turn fragmented details into unified strategies. Seamless integration and instant visibility now define market leaders, enabling teams to act faster than ever. These methods transform raw inputs into precise operational blueprints.
Integrating Data Across Multiple Platforms
Modern solutions like Coupler.io automate connections between CRM systems, financial databases, and marketing tools. This eliminates manual transfers that consume 12-18 hours monthly for most teams. Centralized dashboards display synchronized metrics from inventory levels to client engagement rates.
Automated extraction tools reduce integration costs by 40% compared to custom coding. Teams access cross-platform trends through prebuilt templates, accelerating strategic reviews. Patterns emerge when financial data aligns with campaign performance, revealing hidden opportunities.
Real-Time Reporting for Agile Decision-Making
Live dashboards track pipeline movements and regional demand shifts simultaneously. Managers adjust inventory allocations or outreach tactics within hours rather than weeks. One retail chain reduced overstock costs by 19% using this approach during holiday peaks.
Cloud-based systems update metrics every 15 minutes, ensuring decisions reflect current conditions. Alerts flag deviations from targets, enabling rapid corrections. Teams collaborate using shared visualizations that highlight priority actions, maintaining alignment across departments.