

 Return to
 Mastering Sales Pipeline Management: A Step-by-Step Guide to Optimizing Your Sales Process, Pipeline Metrics, and Deals
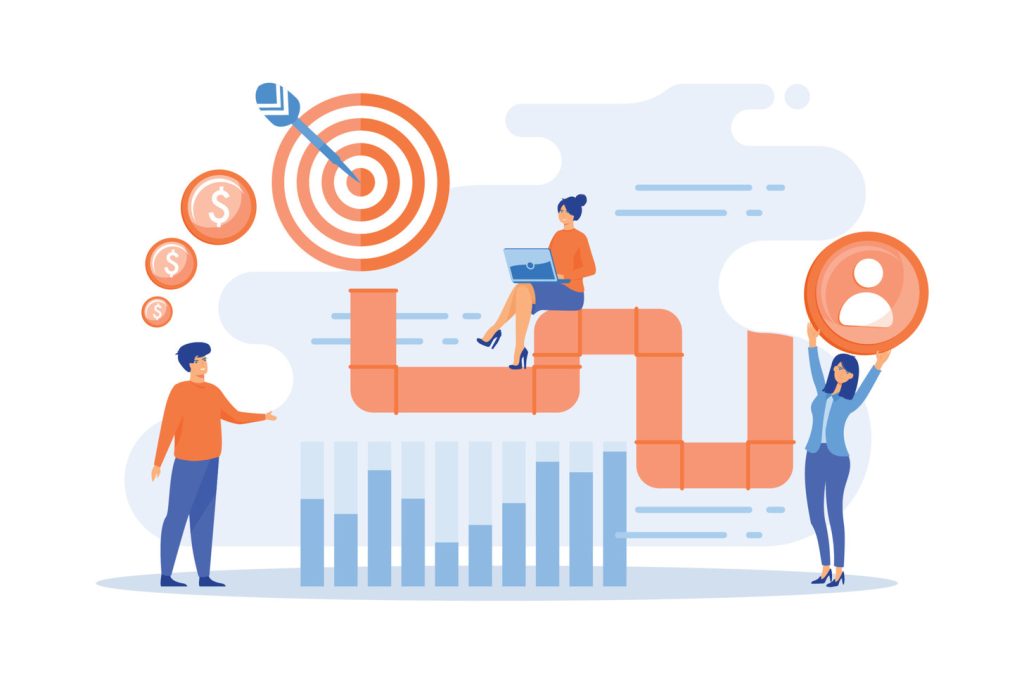
Business growth thrives on predictability, and effective sales pipeline management is the foundation for turning prospects into closed deals. Yet many organizations face erratic revenue streams despite quality products or services. The root cause often lies in disconnected processes for tracking the sales pipeline, the sales funnel, and critical pipeline metrics along the buyer journey. To address these challenges, companies must adopt holistic solutions that integrate their sales processes and provide real-time visibility into performance metrics. As businesses begin to prioritize streamlined operations, they will increasingly turn to technology, specifically the best CRMs for sales in 2025, to enhance their pipeline management. By leveraging advanced analytics and automation, organizations can ensure consistent revenue growth and improved buyer engagement.
Strategic oversight of deal progression separates thriving companies from those struggling to scale. Teams lose confidence when leaders can’t forecast accurately, while customer relationships suffer from inconsistent follow-ups. This gap creates urgent need for systematic frameworks that convert chaos into measurable outcomes.
Modern enterprises require more than basic lead tracking. They need intelligent systems that align team efforts with market realities. For example, integrating CRM automation strategies bridges visibility gaps between departments, ensuring no opportunity slips through cracks. By leveraging these systems, businesses can streamline their processes, enhance communication, and significantly boost productivity. Additionally, exploring the best crm options for sales managers can provide the tools necessary for effective data analysis and customer engagement, ultimately driving higher conversion rates. As a result, organizations can respond more swiftly to market demands and foster stronger relationships with their clients.
Key Takeaways
- Establishes foundation for predictable revenue growth in competitive markets
- Enhances forecasting precision for data-driven leadership decisions
- Converts scattered efforts into repeatable success frameworks
- Optimizes customer acquisition costs through streamlined processes
- Accelerates deal velocity with stage-specific engagement tactics
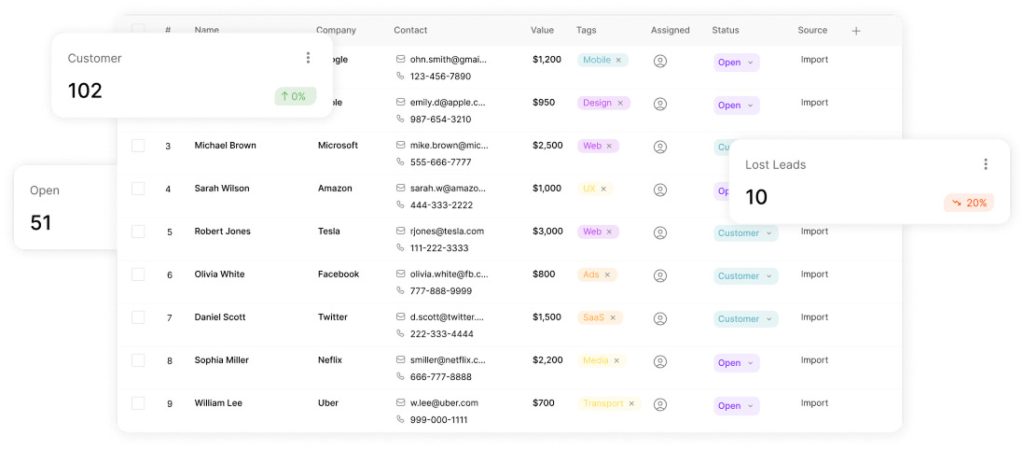
Understanding the Sales Pipeline Landscape
Modern revenue pathways demand clarity in sales pipeline management, ensuring every stage of the sales process aligns with team efforts to close deals.
While many teams track leads, few systematically map how prospects evolve into paying clients. This gap creates inefficiencies – deals stall, forecasts miss targets, and teams misalign priorities.
Defining a Revenue Pathway
A structured pipeline acts as a progress tracker for potential buyers. It outlines key phases from initial contact to closed agreements. Unlike basic lists, this framework shows:
- Real-time status of active opportunities
- Required actions at each phase
- Resource allocation across teams
Stage-Specific Dynamics
Each phase serves distinct purposes. Early stages focus on educating prospects, while later phases prioritize negotiation tactics. Consider this breakdown:
| Phase | Key Actions | Success Metrics |
|---|---|---|
| Discovery | Needs analysis | Qualified lead rate |
| Evaluation | Solution mapping | Demo completion rate |
| Decision | Terms alignment | Close ratio |
Teams using customized stage designs see 37% faster deal progression according to recent CRM studies. The best models mirror actual buyer journeys – not generic templates. This alignment reduces friction and builds trust through relevant interactions.
Effective visualization tools help identify bottlenecks. When a deal lingers too long in one phase, managers can trigger targeted interventions. Such precision transforms scattered efforts into predictable outcomes.
The Importance of Sales Pipeline Management
Visibility into revenue streams separates thriving organizations from those stuck in reactive mode. Companies with structured processes generate 18% more income than competitors, according to industry research. This advantage stems from aligning team actions with measurable outcomes rather than guesswork.
Why Revenue Growth Demands Structure
Clear frameworks turn chaotic workflows into predictable results. When teams track progress systematically, they spot bottlenecks before deals stall. For example, organizations using stage-specific metrics reduce cycle times by 22% on average.
| Business Impact | Operational Benefit | Result |
|---|---|---|
| Predictable forecasting | Real-time progress tracking | 89% fewer revenue surprises |
| Team accountability | Performance benchmarks | 34% higher quota attainment |
| Resource allocation | Priority deal focus | 2.1x faster conversions |
Strategic oversight helps leaders allocate resources where they deliver maximum impact. Teams with complete visibility into active opportunities close 41% more high-value contracts. This precision directly lowers customer acquisition costs while boosting lifetime value.
Investing in robust systems pays dividends beyond immediate income gains. Organizations that master these practices see 27% higher retention rates and improved cross-department alignment. The result? Sustainable growth that outpaces market averages.
Defining Your Sales Pipeline Stages and Process
Building successful buyer pathways starts with understanding real-world behaviors. Organizations that mirror client decision patterns see 43% faster conversions compared to those using generic templates. This approach transforms scattered interactions into intentional progress markers.
Mapping the Buyer’s Journey
Effective stage design begins with three core questions:
- Where do prospects seek solutions in your market?
- What evidence confirms their readiness to advance?
- How do decision timelines vary by client size?
A tech startup’s journey might prioritize product demos, while enterprise buyers require compliance reviews. Teams using behavior-based criteria reduce stalled deals by 31% according to Gartner research.
| Phase | Generic Approach | Customized Strategy |
|---|---|---|
| Prospecting | Cold outreach | Intent signal tracking |
| Evaluation | Standard demos | Use-case simulations |
| Closing | Contract reviews | Stakeholder alignment maps |
Tailoring Stages to Your Business
High-performing teams design progression frameworks around four pillars:
- Documented entry/exit criteria for each phase
- Stage-specific content libraries
- Automated milestone tracking
- Quarterly process audits
“Companies refining stages every 90 days achieve 19% higher win rates than annual revisers.”
This dynamic approach prevents outdated assumptions from derailing leads. When a healthcare provider aligned stages with physician buying committees, their cycle times dropped 27% in six months.
Mapping the Buyer’s Journey Through the Pipeline
Understanding buyer psychology transforms how organizations guide prospects toward decisions. Research shows 94% of B2B buyers conduct independent research before engaging vendors. This self-directed journey demands strategic alignment between client discovery patterns and organizational processes.
Phases That Drive Conversion
Three core phases shape modern purchasing behavior:
| Buyer Phase | Pipeline Stage | Key Actions |
|---|---|---|
| Awareness | Connect | Problem identification via content marketing |
| Consideration | Appointment Completed | Customized solution demonstrations |
| Decision | Proposal Sent | ROI comparisons & contract finalization |
Early phases focus on educating leads through case studies and industry reports. Middle stages build trust with tailored consultations. Final steps address lingering concerns through competitor analysis templates.
Teams using behavior-aligned frameworks report 28% shorter decision cycles. A manufacturing client reduced stalled opportunities by 41% after mapping content to specific evaluation criteria. This precision eliminates friction points where 63% of buyers typically disengage.
“Journey-aligned pipelines convert 2.3x faster than generic models by speaking directly to evolving client priorities.”
Regular audits ensure stages reflect current market realities. Quarterly reviews identify outdated assumptions, enabling rapid strategy adjustments that maintain competitive momentum.
Analyzing Pipeline Metrics and Average Deal Size
Numbers tell the real story behind revenue growth. Tracking core indicators reveals patterns that gut instincts often miss. Teams leveraging pipeline metrics gain actionable insights to refine strategies and allocate resources effectively.
Key Metrics to Track
Critical data points include velocity (how fast prospects move), stage conversion rates, and win/loss ratios. Velocity highlights bottlenecks – deals lingering too long signal misalignment with buyer needs. Conversion rates between phases expose skill gaps or process flaws.
Win rate analysis uncovers hidden trends. Are certain product lines underperforming? Do specific markets yield larger contracts? Tools like effective customer engagement platforms automate this tracking, turning raw numbers into strategic assets.
| Stage | Conversion Rate | Avg. Deal Size |
|---|---|---|
| Discovery | 58% | $12K |
| Proposal | 34% | $28K |
| Negotiation | 67% | $45K |
Benchmarking Conversion Rates
Comparing performance against industry standards identifies improvement areas. If your discovery-to-proposal rate trails competitors by 15%, revisit qualification criteria or follow-up timing. High-performing teams adjust tactics quarterly based on these insights.
Average deal size variations matter. A 22% increase in enterprise contracts might justify reallocating staff to high-value accounts. Regular reviews prevent minor dips from becoming revenue crises.
“Organizations analyzing metrics weekly achieve 31% faster course corrections than monthly reviewers.”
Balancing quantitative data with qualitative feedback creates a complete picture. When metrics show stalled deals, team discussions often reveal overlooked client concerns or competitor moves.
Building a Data-Driven Sales Process
Many organizations drown in numbers but starve for insights. Only 30% of teams effectively harness information to guide decisions – a gap that leaves millions in potential income unrealized. Strategic data use transforms raw numbers into actionable roadmaps for growth.
Forecasting Through Probability Models
Yield percentages assigned to each stage create reliable revenue estimates. Teams using historical conversion patterns predict outcomes with 89% greater accuracy than those relying on intuition. This precision helps prioritize high-potential opportunities while flagging stalled deals.
| Data Practice | Adoption Rate | Forecast Accuracy |
|---|---|---|
| Stage probability models | 42% | ±7% variance |
| Intuition-based methods | 58% | ±23% variance |
Monthly reviews of conversion trends reveal seasonal patterns and market shifts. A logistics company improved quarterly projections by 31% after aligning forecasts with shipping industry cycles. Automated tools track these metrics in real time, enabling swift strategy adjustments.
“Organizations using predictive analytics achieve 2.4x faster quota attainment than peers relying on spreadsheets.” – Gartner Research
Effective models combine three elements: historical close rates, account engagement levels, and competitive landscape analysis. This triad helps teams allocate resources where they deliver maximum impact. Regular process audits ensure methods evolve with changing buyer behaviors.
Effective Lead Qualification and Follow-Up Strategies
Successful buyer engagement hinges on strategic prioritization. Teams waste 79 hours monthly pursuing dead-end opportunities according to recent SaaS industry data. Reverse qualification flips traditional approaches, focusing resources where they yield maximum returns.
Reverse Qualification: Filtering for Quality
This method challenges teams to disqualify leads early using strict criteria. Key indicators include budget alignment, decision authority, and urgency levels. A manufacturing firm using this approach boosted conversion rates 28% while cutting prospecting time by 41%.
- Ask “Why shouldn’t we work together?” during discovery calls
- Require documented proof of budget allocation
- Verify multiple stakeholder buy-in before demos
“Teams applying reverse techniques reduce unqualified leads pipeline by 63% within 90 days.”
Follow-Up Systems That Convert
Persistent engagement separates closed deals from missed chances. Effective sequences combine multiple channels with behavior-triggered timing:
| Touchpoint | Optimal Timing | Response Rate |
|---|---|---|
| Personalized email | Within 2 hours | 34% |
| Video message | Day 3 | 28% |
| Case study share | Day 7 | 19% |
Automation tools ensure consistency without sacrificing personalization. Teams using sequenced outreach achieve 2.7x more meetings than single-channel attempts. Critical elements include:
- Pre-built templates for common objections
- CRM-integrated reminder systems
- Performance analytics dashboards
Leveraging Automation and Sales Tools for Pipeline Efficiency
Technological advancements now empower teams to convert manual workflows into strategic assets. Smart systems reduce cycle lengths by 8-14% while improving forecast accuracy. However, success hinges on user adoption – poorly implemented tools create frustration rather than results.
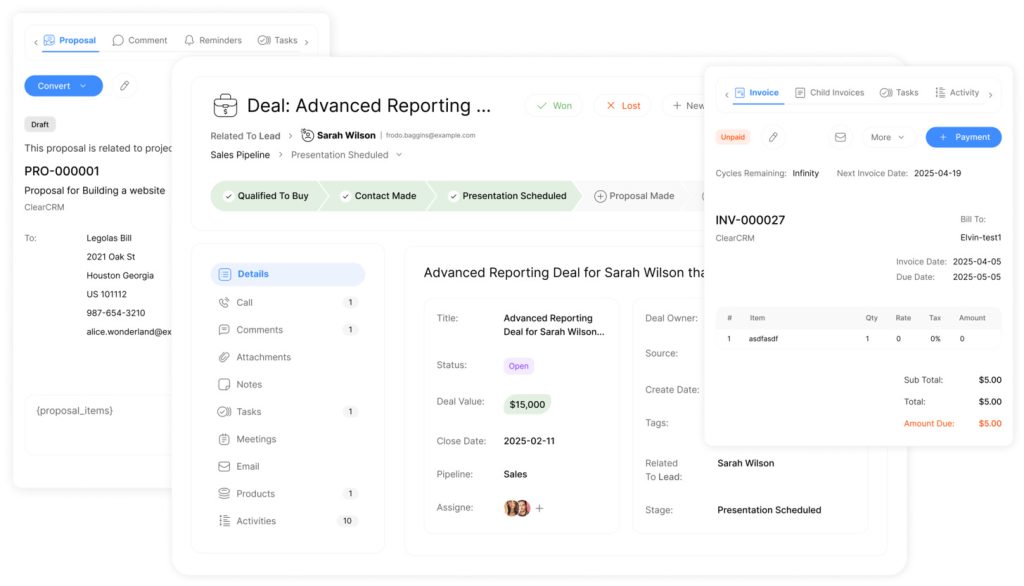
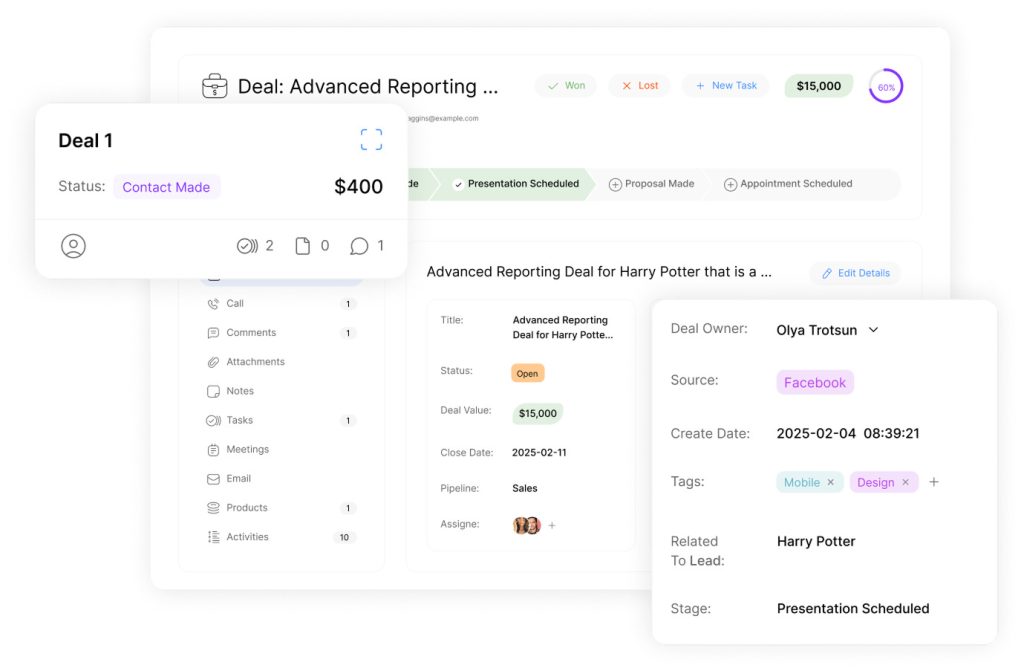
Implementing CRM and Pipeline Tools
Centralized platforms transform how teams track interactions and coordinate efforts. Modern CRM systems eliminate data silos by integrating with existing workflows. This seamless connection prevents duplicate entries and ensures uniform records across departments.
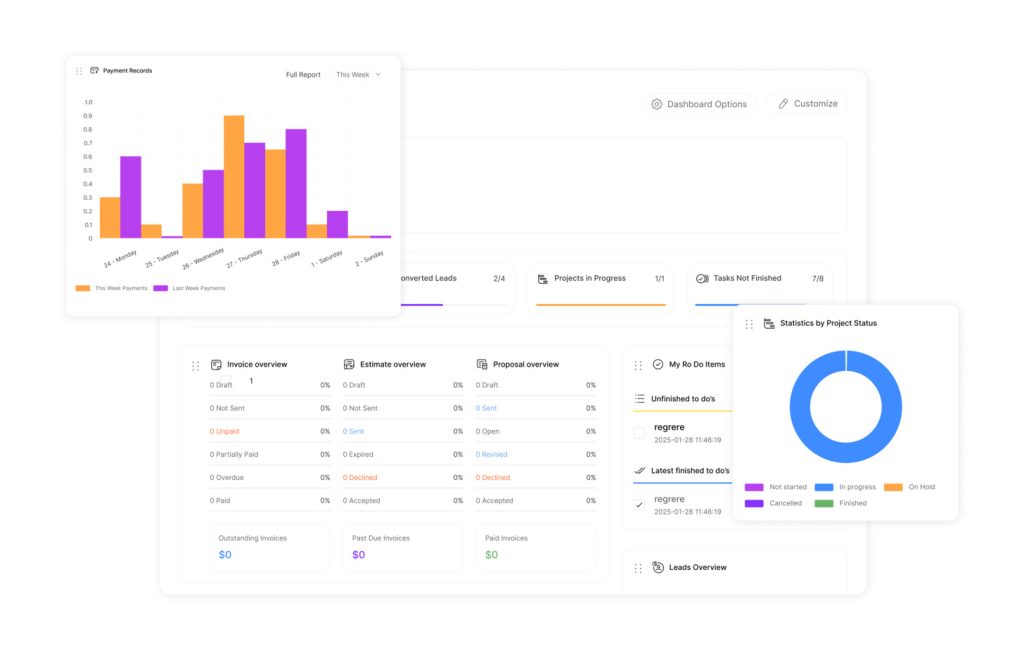
Automation handles repetitive tasks like follow-up reminders, freeing reps to focus on high-value negotiations. Teams using these technologies report 23% more client-facing time weekly. Real-time dashboards highlight stalled deals, enabling swift interventions before opportunities expire.
Effective implementation requires more than software installation. Training programs aligned with daily workflows boost adoption rates by 41%. Organizations that prioritize ease-of-use see faster ROI – often within 90 days of deployment.