

 Return to
 Mastering Project Timeline Visualization: Ultimate Guide
In today’s fast-paced business landscape, effective Mastering Project hinges on clarity and visibility. Project management tools like Gantt charts and Kanban boards are transforming how organizations handle complex initiatives. These visual tools simplify project timelines, helping teams track progress, manage task dependencies, and make informed decisions with ease.
Traditional text-heavy reports slow teams down. Modern project management software replaces them with dynamic, interactive views that map project schedules, resource allocation, and due dates in real-time. This empowers team members to collaborate seamlessly, share insights, and resolve issues without sifting through dense documents.
Adopting visual representation techniques significantly reduces risks like missed deadlines or budget overruns. For example, color-coded roadmaps highlight critical paths, enabling managers to identify bottlenecks and reassign resources quickly. Even stakeholders unfamiliar with technical jargon can stay engaged thanks to intuitive data visualization dashboards that foster communication collaboration across departments.
Businesses leveraging these modern methods report measurable improvements in efficiency, cost control, and project progress. Studies show they reduce delays by up to 30% and resolve conflicts faster through transparent processes. Visual project management tools aren’t just aesthetic—they’re a strategic advantage in competitive, data-driven markets.
Key Takeaways
- Visual tools simplify complex workflows, improving decision-making speed.
- Real-time tracking reduces risks like missed deadlines or resource gaps.
- Intuitive formats bridge communication gaps between technical and non-technical stakeholders.
- Teams using visual systems report fewer delays and budget overruns.
- Color-coded diagrams help identify bottlenecks before they escalate.
Understanding the Fundamentals of Visual Project Management
Efficient team coordination demands methods that transcend traditional documentation. Visual frameworks convert complex workflows into clear, interactive formats, enabling teams to align priorities and track progress without confusion. This approach replaces text-heavy plans with dynamic systems that highlight relationships between tasks, resources, and goals.
Core Principles and Common Language
At its core, visual project management relies on tools like Gantt charts and Kanban boards to map workflows. These systems translate milestones, task dependencies, and resource allocation into graphical layouts. “A well-designed visual plan acts as a universal language,” notes a leading operations strategist. Standardized symbols and color codes ensure all stakeholders interpret data consistently, whether they’re engineers or executives.
Bridging Gaps Through Design
Visual communication eliminates misunderstandings in cross-functional teams. Color-coded status indicators and visual tools allow team members to instantly identify delays, resource constraints, or priority shifts. For example, red blocks signal overdue tasks, while green indicates completion. This clarity reduces emails and meetings by 45%, as teams solve problems directly within dashboards.
Using visual project management tools creates alignment across departments. Marketing can see how their deliverables fit into development sprints, while finance monitors project budgets and resource allocation. The result: faster approvals, fewer reworks, and a 22% improvement in deadline adherence.
The Evolution of Project Timeline Visualization
Organizations have transformed how they track progress over the past decade. Static spreadsheets and text-heavy updates once dominated planning processes. Now, interactive dashboards and real-time charts drive strategic alignment.
From Paper Trails to Interactive Insights
Early reporting methods often buried critical details in dense documents. Teams wasted hours searching for updates or reconciling conflicting data. Modern data visualization tools solve this by converting metrics into actionable graphics.
| Aspect | Traditional Approach | Modern Solution |
|---|---|---|
| Update Frequency | Monthly written reports | Live dashboards |
| Risk Identification | Post-meeting analysis | Automated alerts |
| Stakeholder Access | Email attachments | Cloud-based sharing |
Agile Frameworks Reshape Planning
The rise of agile project management forced tools to adapt. Fixed 12-month plans gave way to flexible sprints. Burndown charts now show daily progress, while velocity metrics predict completion dates.
Teams using these methods resolve issues 40% faster according to 2023 industry data. Continuous feedback loops let managers adjust priorities weekly rather than quarterly. This shift aligns with the demand for rapid responses in competitive markets.
Essential Types of Project Management Charts
Choosing the right framework transforms how teams approach their goals. Visual charts simplify workflows by translating abstract plans into actionable steps. Two dominant formats—Gantt charts and Kanban boards—serve distinct purposes while complementing modern strategies.
Gantt Charts for Scheduling and Tracking
Gantt charts map tasks horizontally across calendar dates, showing durations and dependencies. Managers use them to pinpoint critical paths and allocate resources efficiently. “They turn complex sequences into visual roadmaps,” explains a certified Scrum trainer. Color-coded bars highlight overlapping activities, making delays easier to spot before deadlines.
These tools excel in construction or product launches where phases depend on prior completions. Teams adjust timelines when supplier deliveries slip or approvals stall. Real-time updates keep stakeholders aligned without lengthy meetings.
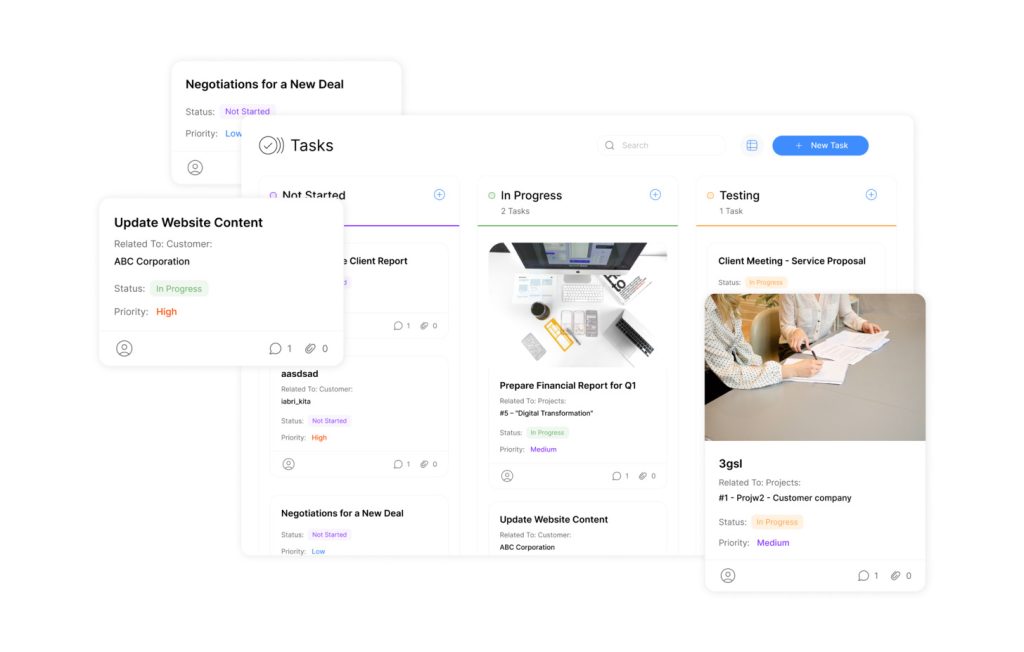
Kanban Boards and Their Applications
Kanban boards break workflows into columns like “To Do,” “In Progress,” and “Done.” Each task moves as a card between stages, revealing bottlenecks instantly. Software teams using this method reduce cycle times by 37% according to 2024 data.
Marketing departments apply Kanban to manage campaigns with shifting priorities. Limiting work-in-progress prevents overloads while maintaining focus. Management tools like Trello or Asana integrate these boards, letting teams customize columns for sprint planning or bug tracking.
“Hybrid systems combining Gantt and Kanban elements adapt to both rigid timelines and agile workflows.”
Integrating Agile Project Management Practices
Modern businesses thrive on adaptability, and agile frameworks deliver precisely that. By prioritizing flexibility over rigid structures, these methods align workflows with evolving priorities. Teams using agile practices report 28% faster response times to market shifts compared to traditional models.
Iterative Sprints and Continuous Improvement
Agile project management replaces linear plans with repeating cycles called sprints. Each 1-4 week phase focuses on delivering functional components while gathering stakeholder feedback. Continuous improvement happens naturally as teams refine processes after every iteration.
Key benefits include:
- Real-time adjustments to scope or resources without derailing overall progress
- Transparent communication through daily standups and sprint reviews
- Visual dashboards tracking burndown rates and backlog items
For example, software teams using agile project frameworks resolve coding issues 50% faster by addressing blockers in daily huddles. Marketing departments apply similar principles to adapt campaigns mid-launch based on analytics.
“Agile isn’t a methodology—it’s a mindset shift that turns uncertainty into strategic advantage.”
Leaders leverage these systems to maintain alignment across departments. Finance tracks budget adherence through sprint retrospectives, while developers showcase incremental releases. This cross-functional visibility reduces miscommunication by 33% according to recent surveys.
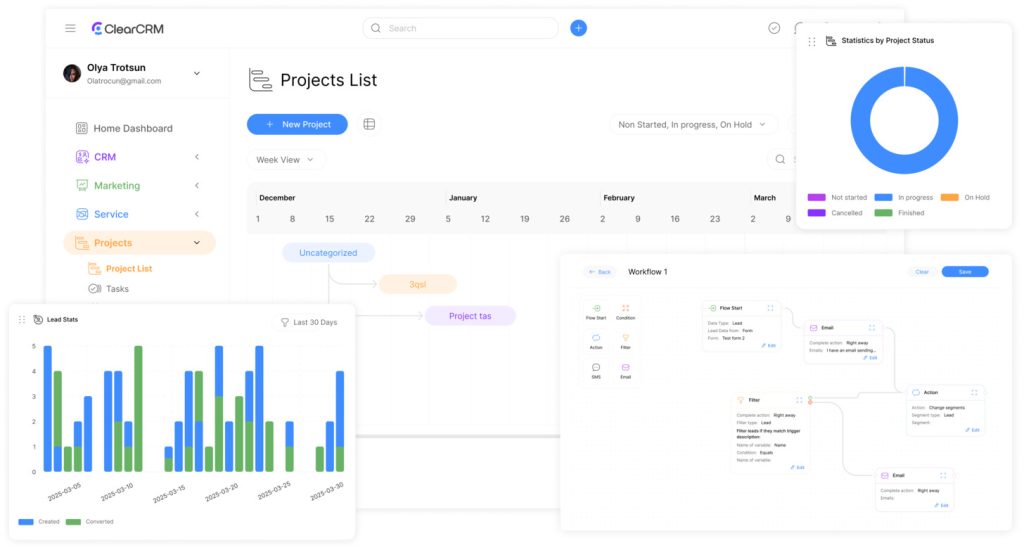
Innovative Tools and Software for Visual Project Management

The right software transforms how teams execute strategies while maintaining clarity. Modern project management tools blend intuitive design with advanced functionality, balancing ease of use with professional-grade capabilities. Drag-and-drop interfaces and prebuilt templates let teams start quickly, while integrations with CRM or accounting systems eliminate workflow silos.
Leading platforms prioritize real-time collaboration through features like @mentions and shared dashboards. Cloud-based access ensures distributed teams update tasks or review progress from any device. “Tools that centralize communication reduce errors by 42% compared to fragmented systems,” states a 2024 tech efficiency report.
Key advantages of advanced management software include:
- Automated scheduling algorithms adjusting timelines based on resource availability
- AI-driven analytics predicting bottlenecks before they delay deliverables
- Mobile-responsive designs enabling updates during client meetings or site visits
Enterprise solutions add layers like custom branding and military-grade encryption. These cater to industries handling sensitive data while scaling for global teams. Whether managing a startup’s launch or a multinational’s portfolio, the best tools adapt to complexity without sacrificing usability.
“Flexibility defines next-gen systems—they must empower both detail-oriented planners and big-picture strategists.”
Creating Effective Visual Timelines and Gantt Charts
Building precise schedules requires merging strategic planning with visual clarity. Start by mapping all deliverables through detailed scope analysis. Identify dependencies between tasks and align them with available resources to create realistic expectations.
Constructing Resilient Roadmaps
Incorporate buffer periods for unexpected delays during design phases. A 2024 operations study found teams adding 15% flexibility to timelines reduced deadline overruns by 41%. Color-coded bars in Gantt charts simplify tracking progress across parallel tasks while highlighting critical paths.
Prioritize hierarchical organization when structuring timelines. Group related activities under parent categories and use consistent labeling. This approach lets stakeholders grasp priorities instantly, whether reviewing quarterly goals or daily updates.
- Sequence tasks based on logical workflows and resource availability
- Automate dependency adjustments through management software to maintain accuracy
- Update charts weekly to reflect real-time changes in team capacity
“Dynamic timelines become decision-making engines when paired with stakeholder transparency.”
Interactive features like drag-and-drop rescheduling empower teams to adapt without disrupting workflows. Combine these tools with regular progress reviews to ensure alignment between visual plans and execution.
Harnessing the Power of Kanban Boards for Team Efficiency
Teams seeking operational excellence increasingly adopt Kanban boards to transform chaotic processes into structured systems. These visual tools map tasks across customizable stages, from ideation to completion. By converting abstract workflows into tangible cards, teams gain instant clarity on priorities and progress.
Strategic Board Configuration
Effective Kanban board setups begin with defining workflow stages tailored to specific processes. Marketing teams might use columns like “Content Drafting” and “Client Approval,” while developers could prioritize “Bug Fixes” and “QA Testing.” Work-in-progress limits prevent overloads—research shows teams maintaining 3-4 active tasks per member achieve 29% faster cycle times.
Advanced customization enhances functionality:
- Swimlanes separate high-priority initiatives from routine work
- Color-coded labels indicate risk levels or department ownership
- Automated triggers move cards when dependencies resolve
“Teams using customized boards reduce status update meetings by 60% through real-time visual tracking.”
Modern Kanban boards integrate with team collaboration platforms, enabling comments and file sharing directly on task cards. This eliminates email chains while preserving context. Leaders monitor throughput rates through analytics dashboards, identifying patterns to optimize recurring workflows.
Successful implementations require regular refinement. Monthly retrospectives help teams adjust board structures as objectives evolve. This continuous improvement cycle turns static tools into dynamic engines for management excellence.
Managing Task Dependencies and Resource Allocation
Modern teams thrive when dependencies and resources are mapped with clarity and precision. Misaligned priorities or overlooked task relationships create costly delays. Visual systems solve this by exposing how individual actions impact broader objectives.
Visualizing Workflows for Strategic Alignment
Color-coded diagrams illustrate connections between tasks, showing which activities must finish before others begin. Teams spot bottlenecks early—like a marketing asset awaiting legal approval—and adjust deadlines proactively. Real-time dashboards display team capacity alongside deliverables, preventing burnout or idle time.
Effective resource allocation relies on three strategies:
- Grouping interdependent tasks to minimize handoff delays
- Assigning backup owners for critical-path items
- Using heatmaps to balance workloads across departments
Cross-functional teams benefit most from these methods. Sales can see how campaign delays affect product launches, while HR aligns hiring with engineering sprints. Integrating these visuals with CRM platforms ensures customer needs directly shape internal priorities.
Leaders who master task dependencies reduce rework by 38% according to 2024 data. They create systems where updates auto-adjust related deadlines, keeping everyone synchronized without manual tracking. This approach turns complex initiatives into predictable, momentum-driven processes.