

 Return to
 How to Generate Customizable Reports for Business Insights

Modern organizations need reporting tools that align with their specific goals. Standard templates often miss critical details, leaving teams without the insights they need. This gap drives demand for adaptable analytics solutions that turn complex information into clear strategies.
Platforms like HubSpot and Google Analytics lead this shift. HubSpot’s specialized tools track customer interactions from first contact to final sale. Google Analytics allows teams to mix metrics like traffic sources with revenue data, creating visuals that simplify trends. Matomo adds depth with 250+ tracking options, helping businesses understand visitor behavior patterns.
These systems do more than crunch numbers. They identify which marketing efforts drive sales, highlight team performance gaps, and reveal customer preferences. Managers use these insights to allocate resources smarter and speed up decision-making. For example, a retail company might discover which email campaigns boost repeat purchases through attribution reports.
The real power lies in matching tools to departmental needs. Sales teams require pipeline analytics, while marketing focuses on campaign ROI. With proper training on platform features, companies eliminate guesswork and base choices on concrete evidence. Automated updates save hours weekly, letting staff focus on strategy instead of spreadsheets.
Key Takeaways
- Adaptable analytics tools help businesses track performance metrics that matter most to their goals
- Major platforms offer specialized reports for sales pipelines, marketing impact, and customer journeys
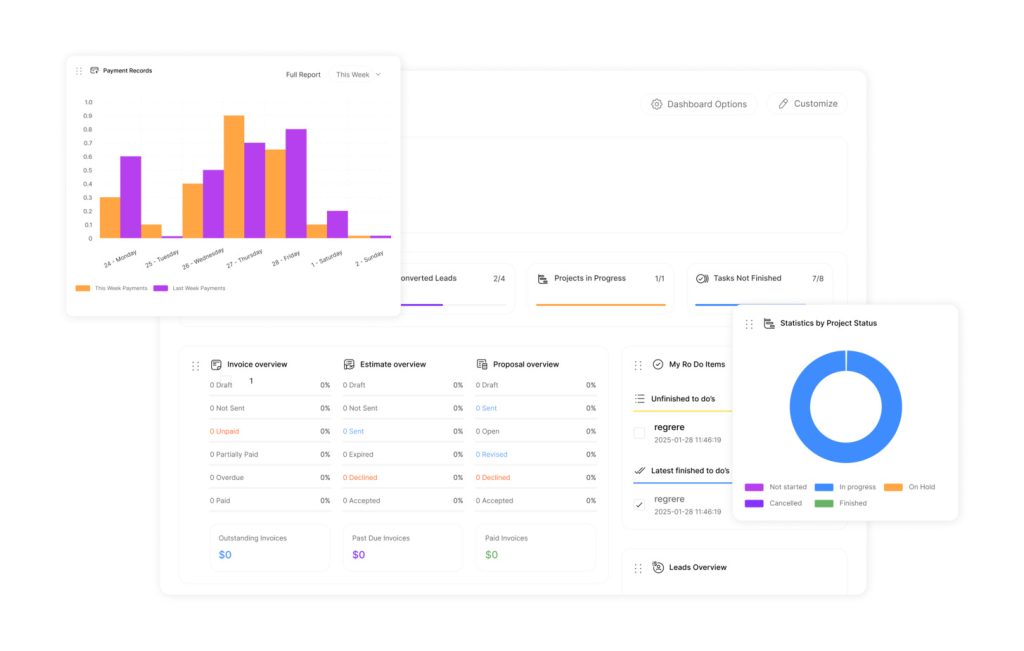
- Visual data presentations make complex information easier to understand and act upon
- Department-specific reporting ensures teams get relevant insights without unnecessary details
- Automated updates reduce manual work while maintaining data accuracy
- Proper training maximizes platform capabilities and drives better decision outcomes
Understanding the Basics of Custom Reports
Custom reports transform raw data into strategic assets for informed decision-making. Businesses achieve this by matching analytical tools to their operational needs. Leading platforms offer distinct approaches to dissect metrics, track conversions, and visualize trends.
Core Analytical Tools Compared
HubSpot’s single object reports analyze contacts, deals, or service tickets with surgical precision. These tools isolate specific data points like payment histories or customer feedback. Funnel reports map buyer journeys across sales pipelines, showing where prospects convert or drop off.
Google Analytics provides four visualization formats. Explorer reports reveal traffic patterns, while map overlays highlight regional engagement. Matomo’s charts track behavior trends over time, helping teams spot seasonal shifts.
Language of Data Analysis
Metrics quantify outcomes like conversion rates or session duration. Dimensions categorize data by source, device type, or campaign name. Together, they create actionable frameworks.
Platform-specific terms matter. HubSpot’s “lifecycle stages” differ from Google’s “user acquisition channels.” Misunderstanding these leads to flawed setups. Teams save hours by learning each tool’s vocabulary before building reports.
Effective analysis balances depth with clarity. A retail company might combine Matomo’s pie charts with HubSpot’s deal tracking to optimize ad spend. This fusion turns scattered information into targeted strategies.
Setting Up Your Reporting Environment
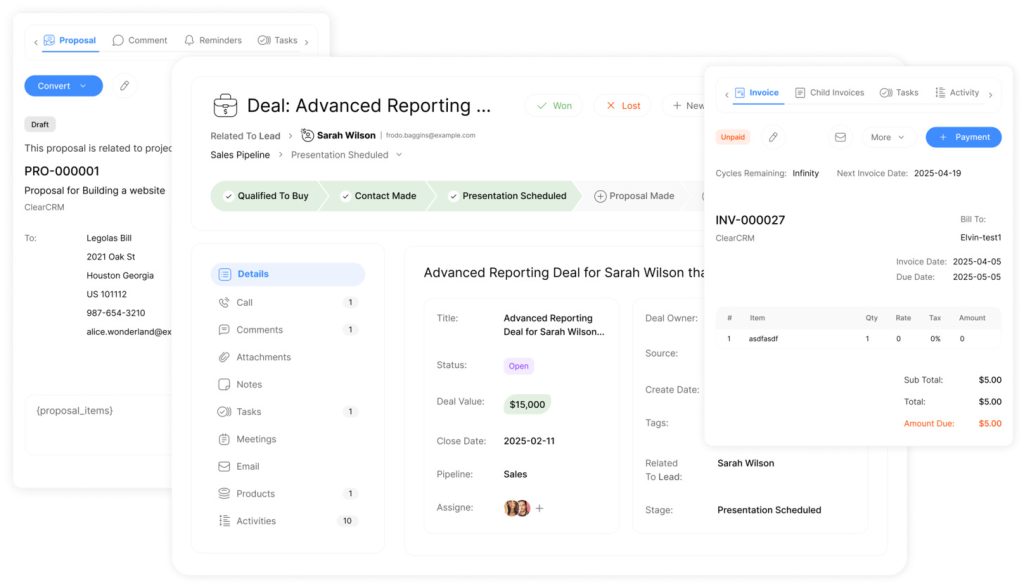
Effective data analysis begins with a properly configured reporting environment. ClearCRM platform setup determines how teams access insights and act on critical metrics. Three elements form this foundation: user permissions, account structures, and navigation workflows.
Access, Permissions, and Account Requirements
Administrators must assign roles carefully. HubSpot requires Create/Own and Edit permissions for building custom reports, with limits based on subscription tiers. Google Analytics users navigate to specific views before selecting Customization > Custom Reports.
Matomo’s Super User status allows cross-website report access. Teams should audit account hierarchies quarterly to match changing responsibilities. A marketing manager might need full dashboard control, while sales reps require filtered data views.
Navigating Report Tools and Dashboards
Each platform uses distinct pathways. Google Analytics places custom reports under the Reports menu, while HubSpot organizes them by object type. Dropdown menus let users choose where reports appear – single views or entire accounts.
Dashboard layouts impact efficiency. Color-coded tabs help teams locate frequent reports faster. Training sessions reduce time spent searching for metrics – a common hurdle during platform transitions.
Permission settings also affect navigation visibility. Restricted users see only approved pages, maintaining data security without limiting essential functions.
Creating Effective Customizable Reports
Data-driven decisions demand reports tailored to specific business needs. The right combination of metrics, dimensions, and filters transforms raw numbers into actionable insights. Platforms like Google Analytics and Matomo offer distinct tools to achieve this precision.
Selecting the Right Metrics and Dimensions
Metrics measure outcomes like conversion rates or page views. Dimensions categorize these results by location, device type, or campaign source. Matomo provides 163 metrics and 94 dimensions, enabling teams to track everything from bounce rates to visitor loyalty.
Align these elements with strategic goals. A marketing team might pair “campaign cost” with “lead generation” metrics to assess ROI. Sales departments often combine “deal stage” dimensions with “close rate” data to forecast revenue.
Using Filters and Report Options for Precision
Filters eliminate noise by focusing on critical patterns. Google Analytics users might isolate Chrome browser traffic with an Include filter. Matomo allows combining three dimensions to reveal connections between geographic data and purchase behavior.
Platform limitations require adaptability. While some tools restrict metric combinations, layered filters compensate by drilling into subsets. A retail company could exclude internal IP addresses while analyzing holiday sales trends.
Effective reports balance depth with simplicity. Prioritize 2-3 core metrics per dashboard and use color coding to highlight trends. This approach ensures stakeholders grasp insights quickly without data overload.
Leveraging Advanced Features and Integration Options
Businesses maximize analytical efficiency by tapping into platform-specific automation and connectivity tools. These features turn static data into dynamic assets that drive time-sensitive decisions across departments.
Automating and Scheduling Report Exports
Matomo simplifies distribution with email and SMS alerts for scheduled updates. Users set daily, weekly, or monthly intervals to keep stakeholders informed without manual actions. HubSpot extends this by letting teams save reports directly to dashboards or export them as CSV files.
Integrating with External Platforms for Enhanced Data Insights
APIs bridge gaps between analytical tools and business applications. Google Analytics shares report configurations while keeping raw data secure. This allows marketing teams to combine ad spend metrics with CRM information for full-funnel analysis.
Utilizing APIs and Raw Data Access
Technical teams leverage Matomo’s HTTP API to build custom tracking solutions. Direct MySQL access enables advanced queries beyond standard dashboards. One e-commerce company used this to correlate checkout abandonment rates with payment gateway performance.
Key integration benefits include:
- Automated delivery systems that eliminate redundant tasks
- Cross-platform data unification for comprehensive insights
- Granular control over information flows through API endpoints
These tools ensure decision-makers receive critical updates on time while maintaining enterprise-grade security protocols. Platform connectivity transforms isolated metrics into actionable business intelligence.
Optimizing Report Utilization for Strategic Decisions
Strategic decision-making thrives when reports adapt to evolving business landscapes. Leading platforms now offer tools that align insights with specific user roles and organizational priorities. This alignment turns data into targeted action plans.
Customization for Different User Segments
Matomo’s segmentation features let teams analyze audience subsets by behavior or conversion patterns. Marketing managers might track first-time buyers, while executives monitor regional sales trends. HubSpot’s attribution reports reveal which content drives deals – critical for allocating budgets.
Google Analytics supports this through secondary dimensions. A retail chain could compare mobile vs desktop purchases across age groups. These granular views help departments focus on metrics that directly impact their goals.
Analyzing Trends and Improving Performance
Historical data comparisons identify long-term patterns. Matomo’s pivot functionality shows how customer preferences shift quarterly. One software company used this to spot rising demand for mobile app features over time.
Google’s dynamic sorting options simplify real-time adjustments. Teams filter top-performing campaigns or flag underperforming regions. Regular metric reviews ensure reports stay relevant as business needs evolve.
Platforms like HubSpot Enterprise measure revenue impacts across touchpoints. This clarity helps leaders invest in high-yield strategies while phasing out ineffective tactics.
Conclusion
Effective decision-making hinges on transforming raw metrics into actionable business strategies. Companies that master custom reports gain clearer visibility into operations while avoiding data overload. Proper setup of user permissions and platform filters ensures teams access relevant information without security risks.
Organizations using tailored reporting systems often outpace competitors through faster adjustments to market shifts. Regular reviews of data collection methods and visualization formats keep insights aligned with evolving business needs. Platforms now offer smarter filtering options and cross-departmental dashboards that simplify trend analysis.
Future success demands ongoing education about emerging tools and reporting standards. Teams that prioritize performance tracking while maintaining flexible account structures will adapt quicker to industry changes. The right balance between automated updates and human interpretation turns numbers into growth opportunities.
Investing in these practices creates organizations where every department works from shared truths – not guesses. This approach builds resilience in uncertain markets and fuels smarter resource allocation over time.