Customer Satisfaction Analytics: How to Measure and Improve

Businesses today face a critical challenge: losing loyal clients over preventable issues. Research from PwC reveals that 32% of clients who strongly favor a brand will abandon it after one negative interaction. This reality underscores the urgency for companies to adopt systematic approaches for tracking and enhancing client experiences.
Effective analysis of client feedback transforms unstructured data into strategic insights. By combining quantitative metrics like Net Promoter Scores with qualitative assessments, organizations gain a 360-degree view of audience sentiment. These methods reveal friction points in service delivery while highlighting opportunities to strengthen retention.
Forward-thinking teams use specialized platforms to monitor trends in real time. Solutions like ClearCRM enable swift identification of emerging concerns, allowing proactive resolution before revenue impacts occur. When paired with operational metrics, this data fuels predictive models that forecast behavior patterns and guide resource allocation.
The benefits extend beyond damage control. Companies leveraging these strategies often see improved product development cycles and stronger market differentiation. By personalizing interactions based on segmented preferences, businesses create tailored experiences that drive measurable improvements in loyalty metrics.
Key Takeaways
- One-third of loyal clients leave brands after single negative experiences
- Combined quantitative and qualitative analysis provides complete sentiment visibility
- Real-time monitoring tools enable proactive issue resolution
- Integrated data sets improve predictive accuracy for client behavior
- Segmented feedback drives personalized experience optimization
Understanding Customer Satisfaction Analytics
Modern organizations convert feedback into strategic fuel. By systematically evaluating how audiences perceive products or services, teams unlock patterns that shape retention and growth. Zendesk reports 52% of buyers prioritize favored brands, proving this analysis directly impacts revenue.
Core Components and Strategic Value
This approach blends numerical scores with contextual insights. For example:
| Data Type | Examples | Impact |
|---|---|---|
| Quantitative | Rating scales, NPS | Tracks trends across regions |
| Qualitative | Survey comments, reviews | Reveals unmet needs |
Platforms like HubSpot CRM merge these datasets to show how support response times affect repeat purchases. This integration helps teams allocate budgets effectively. By leveraging insights from these analyses, companies can identify trends and make informed decisions to enhance customer satisfaction. Additionally, exploring the best customer support software options can further streamline communication, ensuring that customer inquiries are resolved promptly. This strategic approach not only boosts customer loyalty but also maximizes revenue growth potential.
Driving Growth Through Insight
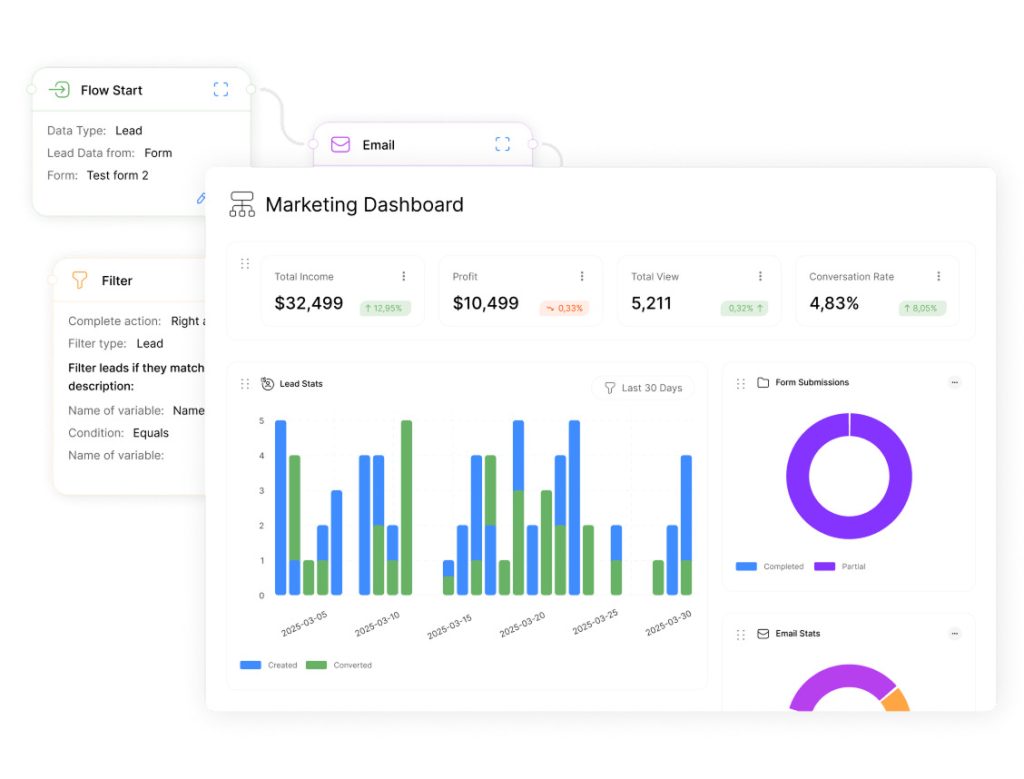
Proactive companies use real-time dashboards to spot emerging issues. A retail chain might notice delivery complaints rising in specific areas. Addressing this quickly prevents client loss and protects brand reputation.
Loyalty grows when businesses act on feedback. Personalized offers based on purchase history or tailored support channels demonstrate commitment. These actions turn casual buyers into advocates who drive organic growth through referrals.
Identifying Key Metrics for Customer Satisfaction

Organizations need precise measurement tools to quantify audience perceptions effectively. Three industry-standard indicators reveal different facets of user interactions: satisfaction scores, loyalty benchmarks, and effort assessments.
Core Measurement Frameworks
The Net Promoter Score (NPS) tracks advocacy potential through a single question: “How likely are you to recommend us?” Responses from 0-10 categorize users into three groups:
- Promoters (9-10): Brand champions driving referrals
- Passives (7-8): Neutral users needing incentives
- Detractors (0-6): At-risk relationships requiring intervention
Transactional satisfaction gets measured through 1-5 ratings in CSAT surveys. These instant feedback snapshots help teams gauge immediate reactions to specific interactions like support calls or purchases.
“Companies combining NPS with effort metrics reduce churn by 23% compared to single-metric approaches.”
The Customer Effort Score (CES) evaluates process efficiency. Users rate how easily they resolved issues or completed tasks, exposing operational bottlenecks. Low CES ratings often predict future loyalty drops before satisfaction scores decline.
| Metric | Primary Purpose | Scale | Key Insight |
|---|---|---|---|
| CSAT | Immediate experience rating | 1-5 | Identifies service hot spots |
| NPS | Loyalty forecasting | 0-10 | Predicts organic growth potential |
| CES | Process efficiency | 1-7 | Reveals hidden friction points |
Leading enterprises combine these metrics in dashboard views. For example, a telecom company might correlate low CES ratings with NPS declines to prioritize workflow improvements. Cross-industry benchmarks then help set achievable improvement targets.
Setting Clear Objectives for Measurement
Successful feedback programs start with razor-sharp goals. Teams that define precise outcomes before collecting data achieve 42% faster improvements in loyalty metrics compared to unfocused approaches, according to Forrester research.
Clear targets transform raw feedback into strategic assets. Organizations must answer three questions: Which operational gaps need addressing? How will insights directly impact revenue? What benchmarks define success?
Connecting Data Strategies to Business Outcomes
Top performers map measurement initiatives to specific growth levers. A SaaS company might link support ticket analysis to feature adoption rates. Retailers often correlate checkout experience ratings with repeat purchase likelihood.
| Business Goal | Data Focus | Target Metric |
|---|---|---|
| Reduce churn | Product usability feedback | 15% CES improvement |
| Boost referrals | NPS trends | 25% promoter growth |
Cross-department alignment prevents wasted effort. Marketing teams might prioritize brand perception metrics, while product groups track feature-specific ratings. Shared dashboards ensure all stakeholders see how their work impacts overarching goals.
- Establish baseline metrics before launching initiatives
- Set 90-day improvement targets for quick wins
- Review objectives quarterly against market shifts
“Organizations with documented measurement strategies achieve 3.2x higher ROI from feedback programs than those relying on generic surveys.”
Resource allocation follows objective clarity. Teams investing in voice-of-client tools typically see 18-month payback periods through reduced support costs and increased retention. Continuous refinement keeps programs aligned with evolving priorities.
Designing Effective Customer Satisfaction Surveys

Crafting high-impact surveys demands precision in both structure and execution. Strategic design captures actionable insights while maintaining engagement. Industry leaders achieve 68% completion rates through optimized formats that respect respondents’ time.
Choosing the Right Question Types
Effective instruments blend quantitative and qualitative elements. Rating scales (1-5) provide measurable benchmarks, while open-ended prompts uncover unexpected pain points. A telecom company improved resolution times by 40% using this dual approach.
| Question Type | Best Use Cases | Data Outcome |
|---|---|---|
| Multiple Choice | Product feature preferences | Prioritization matrix |
| Likert Scale | Service experience ratings | Performance benchmarks |
| Text Response | Improvement suggestions | Innovation opportunities |
Balancing Survey Length and Depth
Three-question formats maintain focus while gathering essential data. Conditional logic tailors follow-ups based on initial answers. For example, low ratings trigger specific probes about service gaps.
Mobile optimization increases completion rates by 33%. Progress bars and time estimates reduce abandonment. Tools like SurveyMonkey enable branching logic that adapts to user inputs in real time.
“Surveys under 90 seconds achieve 2.4x more responses than longer formats while maintaining data quality.”
Pre-testing identifies confusing phrasing before launch. Retail chains using iterative design reduce ambiguous questions by 62%. This ensures collected information directly informs operational improvements.
Leveraging Technology and Tools for Data Collection
Advanced data collection systems now serve as the backbone of audience experience strategies. Platforms like Userpilot and Zendesk transform scattered feedback into structured insights through automated workflows. These tools capture input across multiple channels – from in-app interactions to post-service surveys – ensuring comprehensive coverage.
Platform Capabilities Compared
| Tool | Key Features | Primary Use Case | Impact |
|---|---|---|---|
| Userpilot | In-app surveys, behavior tracking | Product experience optimization | 42% faster feature adoption |
| Zendesk | Automated interaction surveys | Service quality monitoring | 31% resolution time reduction |
| Google Analytics | Behavior flow analysis | Journey mapping | Identifies 68% of drop-off points |
| Drip | Segmented email campaigns | Targeted feedback collection | 3x higher response rates |
Integrated systems eliminate data silos by connecting survey results with operational metrics. Real-time dashboards in Userpilot reveal how specific features influence loyalty scores. Zendesk’s instant pop-up surveys measure service quality immediately after support interactions.
“Companies using integrated feedback systems achieve 19% higher retention rates than those relying on manual processes.”
Scalable solutions adapt as organizations grow. Automated email campaigns through Drip maintain consistent feedback loops with expanding audiences. Social media listening tools complement these platforms by capturing unsolicited input from public channels.
Seamless CRM integrations ensure insights directly inform business decisions. Teams can prioritize improvements based on quantifiable impact – from reducing support tickets to boosting referral rates. This technological foundation turns raw data into strategic action plans.
Timing and Triggers for Optimal Survey Responses

Strategic timing transforms feedback collection from guesswork to precision. Organizations achieve 68% higher response rates when deploying surveys within 90 minutes of key interactions, according to Qualtrics research. This approach captures authentic reactions before experiences fade from memory.
Pinpointing Engagement Peaks
Journey mapping tools like Userpilot reveal critical moments for feedback collection. These include post-purchase confirmation screens or completed support tickets. Teams using event-triggered surveys receive 53% more actionable insights than those relying on random distribution.
| Timing Strategy | Implementation | Impact |
|---|---|---|
| Post-interaction triggers | Automated survey after feature usage | 42% faster issue detection |
| Milestone-based surveys | Onboarding completion alerts | 31% higher completion rates |
| Inactivity follow-ups | 90-day usage gap analysis | 27% churn reduction |
Behavior-based deployment outperforms fixed schedules. A SaaS company increased feedback quality by 38% by sending surveys only to active users. Mobile app developers achieve best results when triggering surveys after third successful login attempts.
“Real-time triggers capture 73% more detailed feedback than weekly survey blasts.”
Effective programs combine automation with testing:
- A/B test delivery times across time zones
- Align survey frequency with usage patterns
- Pause triggers during known service disruptions
These methods maintain relevance while preventing survey fatigue. Teams using dynamic timing strategies report 22% higher retention compared to static approaches.
Analyzing Customer Feedback and Data Insights
Data transforms into action when organizations master feedback analysis. Effective teams use visual dashboards to spot patterns in satisfaction scores and effort metrics. Heat maps reveal regional service gaps, while trend lines track progress after improvement initiatives.
Visual Patterns Drive Decisions
In particular, interactive charts make complex datasets accessible.
For instance, a telecom company might overlay net promoter scores with billing cycle dates to identify pain points. Furthermore, color-coded graphs highlight demographics needing targeted support – like millennials struggling with app navigation.
Balancing Numbers and Narratives
To begin with, natural language processing tools analyze open-ended responses at scale.
As a result, these systems flag recurring phrases in product reviews, helping teams prioritize fixes.
For example, one retailer discovered 18% of negative comments mentioned checkout delays through this method.
Predictive models forecast churn risks using historical effort score data. When combined with purchase frequency, these insights help craft personalized retention offers. Teams achieve 37% faster response times by automating alert triggers for critical feedback.
Continuous analysis closes the loop between client input and operational change. Organizations adopting these practices see 29% higher referral rates within six months. The result? Stronger relationships built on responsive, data-driven adjustments.

