

 Return to
 Mastering CRM Advanced Dashboards: Best Practices Guide
In today’s fast-paced business environment, companies need powerful tools to turn overwhelming amounts of customer information into clear strategies. Interactive platforms now transform raw numbers into visual stories, helping teams spot trends and make smarter choices.
These systems serve as central hubs for tracking sales progress, customer behavior, and team efficiency. Unlike basic reporting methods, they combine information from multiple streams into real-time displays. This shift from static spreadsheets to dynamic interfaces helps organizations act faster and stay ahead of competitors.
Business leaders increasingly rely on these tools to eliminate data silos. By creating unified views of customer interactions and sales pipelines, teams gain a complete picture of operations. This approach leads to better forecasting and stronger client relationships.
Key Takeaways
- Modern visualization tools turn complex information into actionable strategies
- Real-time tracking improves response times in sales and customer service
- Unified data displays help teams break down departmental barriers
- Interactive analytics boost decision-making speed and accuracy
- Predictive features in newer systems enable proactive business planning
The right platform does more than display numbers—it reveals opportunities. Companies using these solutions report 28% faster decision-making and 19% higher customer retention, according to recent industry studies. As markets evolve, the ability to quickly interpret data becomes a key competitive edge.
Introduction: The Evolution of CRM Dashboards
Business intelligence tools have transformed how teams interact with client information. Early systems stored basic details like phone numbers and purchase histories. Today’s solutions map entire customer journeys across digital and physical channels.
From Storage to Strategy
Modern platforms analyze interactions from emails, social media, and websites. This shift lets teams spot patterns faster. Real-time analytics replace monthly reports, helping managers adjust tactics daily.
“Combining communication channels into unified profiles changes how companies predict client needs.”
| Traditional Systems | Modern Solutions | Business Impact |
|---|---|---|
| Static contact lists | Interactive behavior maps | 19% faster issue resolution |
| Manual data entry | Automated trend detection | 23% higher lead conversion |
| Departmental silos | Cross-team visibility | 15% reduced operational costs |
Driving Results Across Teams
Sales groups track pipeline health through visual metrics. Marketing teams test campaign effectiveness using live feedback loops. Support staff prioritize tickets based on client value and urgency.
These tools create alignment between departments. A retail study showed companies using integrated systems achieved 34% shorter decision cycles. Teams spend less time compiling reports and more time acting on opportunities.
Understanding CRM Dashboards: Definition and Functionality
Visual tools have become essential for teams managing client relationships at scale. These systems convert scattered information streams into organized visual narratives, helping organizations identify trends and prioritize actions.
Defining Key Concepts and Metrics
Core measurements in these platforms track progress across sales pipelines and customer interactions. Conversion rates, customer lifetime value, and lead response times emerge as critical indicators. Real-time updates ensure teams base decisions on current market conditions rather than outdated reports.
- Sales cycle length tracking improves forecasting accuracy
- Cost-per-acquisition metrics optimize marketing budgets
- Service response rates highlight operational bottlenecks
How Visual Analytics Elevate Decision-Making
Interactive charts and heat maps reveal patterns hidden in raw numbers. A financial services firm recently used drill-down features to discover 27% untapped upsell opportunities within existing accounts. Role-based access controls let managers customize views while protecting sensitive information.
“Visual interfaces turn information overload into strategic clarity – that’s where true competitive advantage forms.”
These platforms eliminate manual report generation. Users filter results by region, product line, or timeframe with three clicks. This flexibility helps teams align daily actions with long-term business goals.
Best Practices for CRM Advanced Dashboards
Organizations need structured approaches to transform raw information into operational excellence. Successful teams combine technical capabilities with human expertise, creating systems that adapt as needs evolve.
Building Foundations for Success
Effective implementation starts with mapping information flows across departments. A healthcare provider recently reduced reporting errors by 41% through centralized data validation processes. Phased rollouts allow teams to test configurations while maintaining daily operations.
| Traditional Approach | Modern Method | Impact |
|---|---|---|
| Single-department focus | Cross-team workflows | 32% faster implementations |
| Fixed metrics | Custom KPIs | 27% higher goal alignment |
| Annual reviews | Continuous optimization | 19% cost reduction |
Transforming Insights into Action
Sales teams using real-time trend analysis achieve 23% shorter conversion cycles. Marketing groups correlate campaign spending with customer lifetime value, redirecting budgets to high-performing channels. Regular system audits maintain data quality as market conditions shift.
“Teams that align analytics with daily workflows see decision accuracy improve by 35% within six months.”
Ongoing training programs help employees interpret visualizations effectively. A retail chain reported 29% faster onboarding after introducing interactive learning modules. These efforts ensure tools deliver value long after initial deployment.
Benefits of Utilizing CRM Advanced Dashboards
Forward-thinking organizations unlock hidden potential by transforming scattered information into strategic assets. These platforms merge customer touchpoints into unified profiles, revealing patterns that drive smarter decisions and stronger outcomes.
Strengthening Client Connections
Combining communication channels and purchase histories creates detailed behavior maps. Teams spot service gaps and personalize interactions using real-time insights. Neobank Northmill boosted sign-up conversions by 30% after identifying onboarding bottlenecks through visual journey mapping.
“Seeing every client action in one place lets us anticipate needs before they arise – that’s relationship-building at scale.”
Predictive tools flag at-risk accounts early, enabling targeted retention campaigns. Retailers using these features report 22% higher repeat purchase rates through tailored promotions based on buying habits.
Accelerating Revenue Growth
Sales teams track pipeline health through dynamic metrics like lead response times and deal velocity. Managers redistribute resources instantly when dashboards highlight regional opportunities. One software firm increased quarterly bookings by 18% after reallocating staff to high-performing territories.
Marketing groups refine campaigns using conversion data across channels. Automated lead scoring prioritizes prospects most likely to buy, shortening sales cycles. A manufacturing company achieved 27% faster deal closures by aligning outreach with demonstrated buyer interests.
These systems turn information into action – the true measure of business intelligence. Organizations that master this balance see sustained growth through informed strategies and responsive operations.
Advanced CRM Enhancements and Integration Features
Modern organizations require systems that bridge departmental gaps while maintaining cost efficiency. Enhanced platforms now extend core capabilities through intelligent add-ons, eliminating the need for multiple disconnected tools. These solutions prioritize adaptability, ensuring teams work with current information across all functions.
Seamless Connection Across Platforms
Integrated systems merge financial, sales, and service data into single interfaces. A manufacturing company recently streamlined order processing by linking inventory management with customer profiles. This approach reduced fulfillment errors by 38% without requiring separate software investments.
Cost-effective implementations deliver enterprise-grade features through familiar interfaces. Teams access upgraded reporting and automation within existing workflows. One retailer achieved 90% of premium platform benefits at 10% of the typical implementation cost.
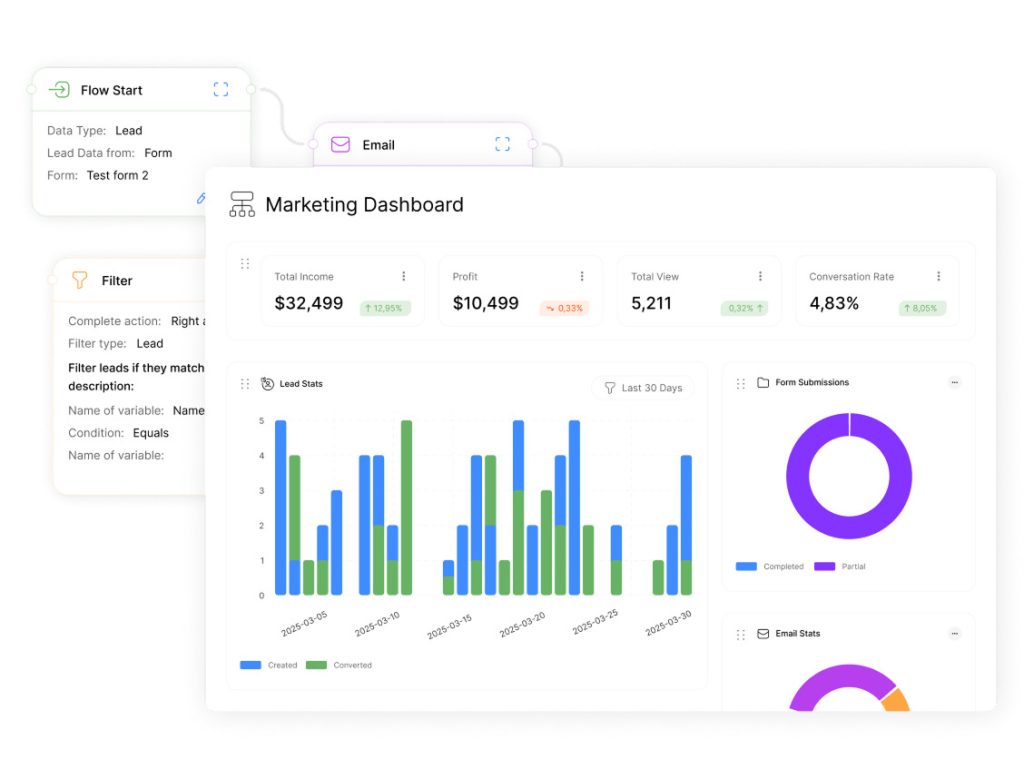
Smart Analysis for Faster Outcomes
AI-powered analytics transform raw numbers into predictive insights. Marketing teams using these tools automatically receive campaign optimization suggestions based on buyer behavior patterns. Real-time updates ensure strategies adapt to shifting market conditions within minutes.
Automated workflow management reduces manual tasks by 57% in typical deployments. Sales groups receive prioritized lead lists while accounting teams reconcile transactions faster. A logistics firm improved delivery performance by 21% using live route optimization suggestions.
“Systems that learn from data patterns become strategic partners, not just record-keeping tools.”
Scalable architectures support growth without compromising speed. As user numbers or data volumes increase, intelligent resource allocation maintains system responsiveness. This flexibility future-proofs operations while keeping operational costs predictable.
Optimizing Sales Pipeline and Conversion Rates through Dashboards
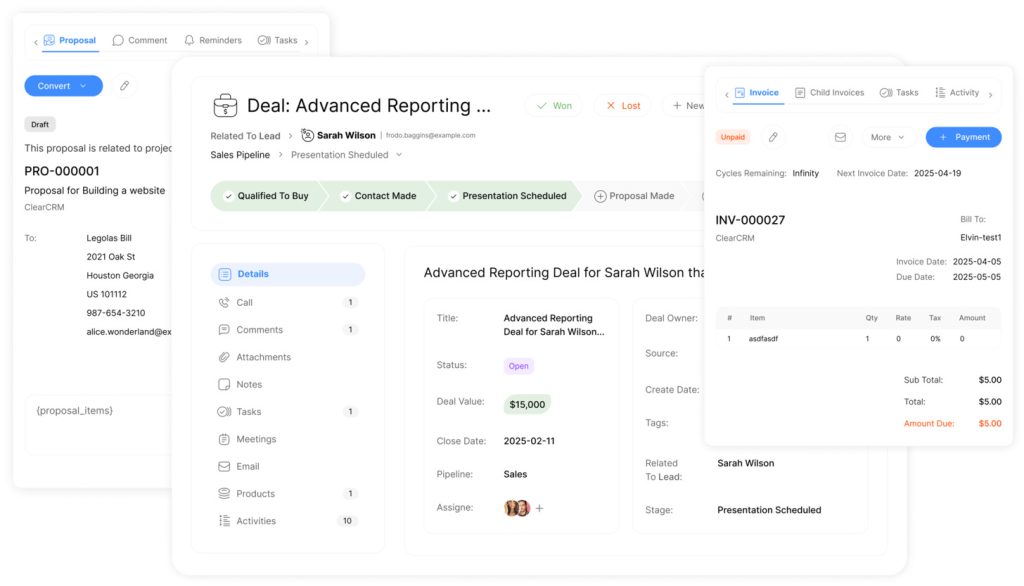
Sales teams require visibility into every stage of buyer journeys to maximize results. Modern tracking tools transform scattered information into strategic roadmaps, helping organizations prioritize high-value actions.
Tracking Sales Opportunities and Performance Metrics
Real-time analytics spotlight bottlenecks in deal progression. Managers identify stalled opportunities through visual indicators, enabling faster course corrections. Teams using these systems report 22% shorter sales cycles by addressing delays before they impact revenue.
| Traditional Tracking | Modern Approach | Results |
|---|---|---|
| Manual updates | Automated progress alerts | 31% faster follow-ups |
| Quarterly reviews | Daily pipeline scans | 19% higher win rates |
| Gut-feel prioritization | AI-driven opportunity scoring | 27% better resource allocation |
Predictive models analyze historical sales data to forecast conversion probabilities. Teams focus efforts on high-potential deals while nurturing long-term prospects. One tech firm boosted quarterly revenue by 18% using these actionable insights.
“Seeing real-time pipeline health metrics lets us shift strategies before targets slip – that’s the power of visual analytics.”
Performance dashboards highlight individual and team achievements. Managers spot coaching needs through comparison tools, driving consistent improvement. Automated alerts ensure critical opportunities receive timely attention, reducing missed deadlines by 41% in recent deployments.
They transform raw data into strategic growth engines. By aligning daily actions with pipeline priorities, organizations achieve measurable gains in both speed and accuracy.
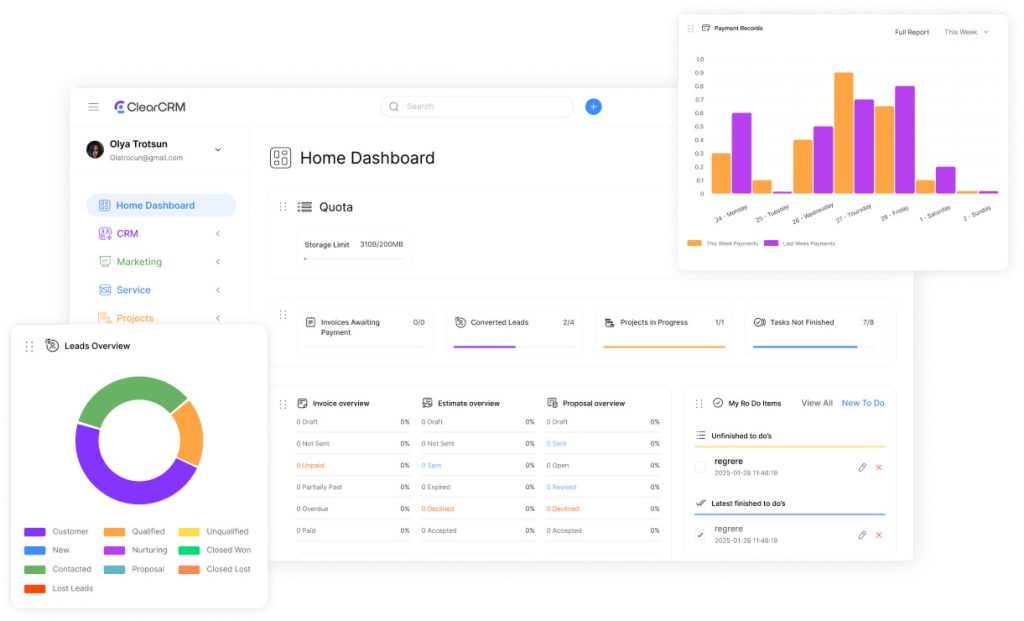
Customization and Scalability: Tailoring Your Dashboard
Businesses need tools that adapt as quickly as their markets change. Modern systems let teams reshape interfaces and workflows to match shifting priorities. This flexibility helps organizations stay efficient through growth spurts and strategic pivots.
Flexible Design and Personalized Role Centers
Role-specific layouts streamline workflows by showing relevant metrics first. Sales agents see lead pipelines, while managers monitor team performance. A telecom company improved task completion by 34% after implementing tailored views.
| User Role | Key Features | Productivity Gain |
|---|---|---|
| Agents | Lead tracking, quick templates | 28% faster follow-ups |
| Managers | Team analytics, forecast tools | 19% better forecasting |
| Executives | Revenue dashboards, KPI summaries | 23% quicker reviews |
Drag-and-drop editors let users build custom displays without coding. Color-coded charts and branded themes improve clarity while reinforcing company identity. Security settings ensure sensitive data stays visible only to approved personnel.
Task Tracking and Automated Reporting Solutions
Integrated to-do lists sync with calendar systems to prevent missed deadlines. Automated alerts notify teams about overdue tasks or approaching milestones. One logistics firm reduced project delays by 41% using these features.
| Process | Manual Approach | Automated Solution |
|---|---|---|
| Report generation | 4 hours weekly | 15 minutes weekly |
| Data updates | Delayed syncs | Real-time refresh |
| Task reminders | Email chains | System alerts |
“When tools match how teams actually work, adoption rates soar – that’s where real transformation begins.”
Self-service analytics empower users to create custom reports. Prebuilt templates help new hires start analyzing data immediately. Scheduled exports ensure stakeholders receive critical updates without manual intervention.
Overcoming Limitations of Native CRM Reporting Tools
Standard reporting tools often fall short when teams need deeper analysis. Many platforms struggle with combining information from multiple sources, leaving gaps in strategic visibility. This limitation forces organizations to make decisions with incomplete pictures of customer interactions and sales processes.
Breaking Through Data Barriers
Native systems frequently restrict users to single-source reporting, making cross-departmental analysis challenging. Teams face rigid visualization options that can’t adapt to evolving business needs. A recent study found 68% of managers waste time manually merging data from separate reports.
Third-party integrations solve these constraints by enabling:
- Combined metrics from sales, service, and marketing channels
- Customizable charts that highlight emerging trends
- Drag-and-drop interfaces for rapid customization
These enhancements transform static numbers into actionable insights. One financial services firm improved forecast accuracy by 37% after implementing flexible reporting tools. Real-time dashboards now help teams align sales strategies with current market conditions.
Advanced solutions also address customer service gaps through unified communication tracking. By connecting support tickets with purchase histories, teams identify recurring issues faster. This approach turns reporting limitations into opportunities for smarter decision-making across departments.