

 Return to
 Effective Custom Reports: Strategies and Techniques
Modern organizations grapple with overwhelming amounts of data, creating challenges that generic reporting tools can’t solve. Static dashboards and prebuilt templates often fail to address unique operational needs, leaving critical insights buried in spreadsheets. This gap has fueled demand for tailored approaches that turn raw numbers into strategic clarity.
Tailored reporting systems empower teams to focus on metrics that directly impact their goals. By aligning solutions with specific objectives, businesses eliminate irrelevant noise and prioritize actionable intelligence. The result? Faster decision-making, sharper competitive edges, and measurable improvements in operational efficiency.
Success hinges on balancing technical precision with practical business understanding. Professionals must map data architecture to stakeholder priorities while maintaining flexibility for evolving needs. Scalable frameworks ensure these systems grow alongside organizations without compromising accessibility or performance.
Adopting this approach requires more than software—it demands collaboration between management and technical teams. Clear communication bridges gaps between data capabilities and real-world applications, ensuring every report drives tangible outcomes. When executed well, tailored analytics become a cornerstone of organizational excellence.
Key Takeaways
- Tailored reporting addresses unique business needs better than generic templates
- Strategic alignment of data systems enhances decision-making speed and accuracy
- Scalability ensures reporting tools adapt to organizational growth
- Cross-department collaboration maximizes the value of analytical insights
- Focusing on relevant metrics eliminates noise in data interpretation
Introduction to Custom Reports
Standardized reports often miss the mark in today’s complex business environment. Tailored solutions bridge this gap by aligning analytics with specific operational demands, transforming raw numbers into strategic clarity.
What Are Tailored Analytical Tools?
These tools let teams handpick metrics, dimensions, and display formats to answer precise questions. Unlike rigid templates, they adapt to unique workflows, prioritizing critical insights over generic data dumps. Users control filtering options, visualization styles, and interactive elements—crafting outputs that mirror their decision-making processes.
Why Precision Matters in Data Strategy
Businesses thrive when analysis reflects shifting priorities. Tailored systems track relevant KPIs while excluding irrelevant noise, accelerating response times to market changes. One retail chain slashed inventory costs by 18% after redesigning their dashboards to highlight supplier lead times and regional demand patterns.
Adaptable frameworks also foster collaboration. Marketing and finance teams share unified views of campaign ROI when reports blend budget allocations with conversion metrics. This alignment cuts through departmental silos, turning fragmented information into cohesive action plans.
Setting Up Your Custom Reports
Effective data analysis starts with building adaptable reporting frameworks. Organizations gain strategic clarity when tools match their operational rhythms. This process demands technical precision and an understanding of stakeholder priorities.
Accessing and Configuring Your Reporting Tools
Modern platforms simplify configuration through guided workflows. Begin by evaluating existing tools in your tech stack. Most solutions offer step-by-step options for defining data sources and refresh schedules.
Google Analytics demonstrates this approach. Users navigate to their designated view, select customization menus, and activate new report templates. The platform offers four display formats—each serving distinct analytical needs. Explorer tabs reveal trends through dynamic graphs, while flat tables provide static comparisons.
Designing Custom Layouts and Visual Elements
Visual elements transform raw numbers into actionable insights. Prioritize chart types that mirror decision-making processes. Heatmaps highlight geographic engagement, while funnel diagrams expose conversion bottlenecks.
Advanced users leverage multiple tabs to consolidate perspectives. A marketing team might combine campaign metrics with budget allocations on separate panels. Color-coding critical thresholds ensures stakeholders spot trends instantly.
Filters add depth without clutter. Configure dropdown options to let viewers isolate regional data or product lines. This flexibility maintains focus while preserving access to broader organizational metrics.
Mastering Custom Reports for Business Analysis
Organizations achieve peak performance when their data systems reflect specific strategic priorities. Tailored analytical solutions transform raw information into targeted insights, bridging gaps between operational realities and leadership vision. This alignment turns complex datasets into clear pathways for growth.
Aligning Reports with Strategic Business Objectives
Every successful business initiative starts with measurable targets. Analytical tools must track metrics that directly influence revenue, efficiency, and market position. A logistics company improved delivery speeds by 23% after redesigning dashboards to prioritize route optimization data.
Cross-department collaboration ensures reports address evolving needs. When marketing and operations teams share real-time inventory metrics, they eliminate production bottlenecks during peak sales periods. This synergy between data and decision-making drives competitive advantages.
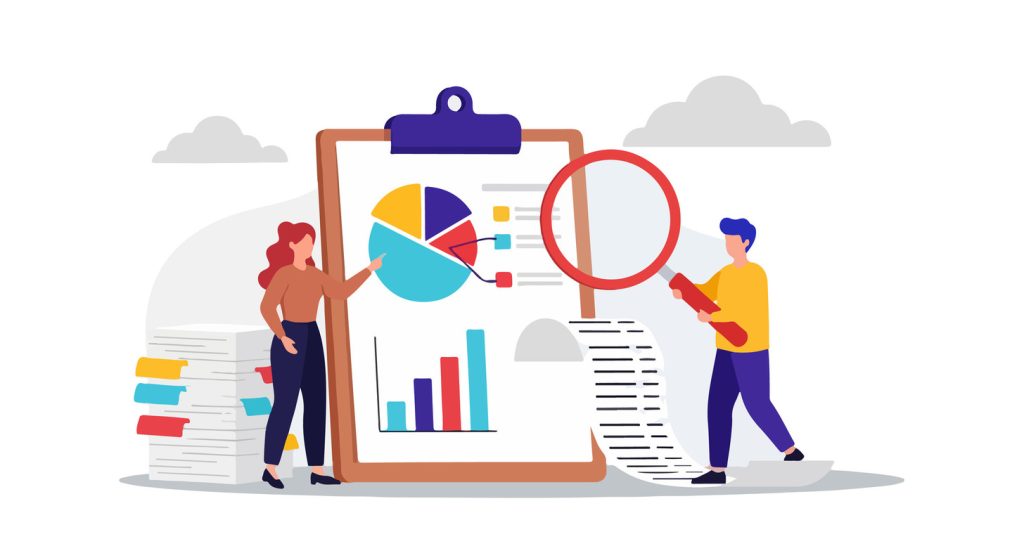
Enhancing Data Insights through Customization
Advanced filtering options reveal patterns generic templates miss. Financial teams using layered analysis identified $1.2M in redundant expenses by comparing vendor contracts across regions. Dynamic visualizations spotlight trends faster than static spreadsheets.
Precision in data presentation matters. Interactive heatmaps helped one retailer optimize shelf layouts, boosting in-store conversions by 14%. These tools let organizations test scenarios and predict outcomes before committing resources.
Scalable frameworks adapt as companies grow. Modular dashboards allow teams to add new metrics without overhauling entire systems. This flexibility keeps insights relevant amid shifting market conditions.
Custom Reporting Techniques and Tools
Data-driven decision-making demands tools that adapt to organizational rhythms. Tailored analytical frameworks bridge the gap between raw data and strategic action, enabling teams to surface patterns hidden in spreadsheets. The right mix of visualization and interactivity turns complex datasets into clear roadmaps for growth.
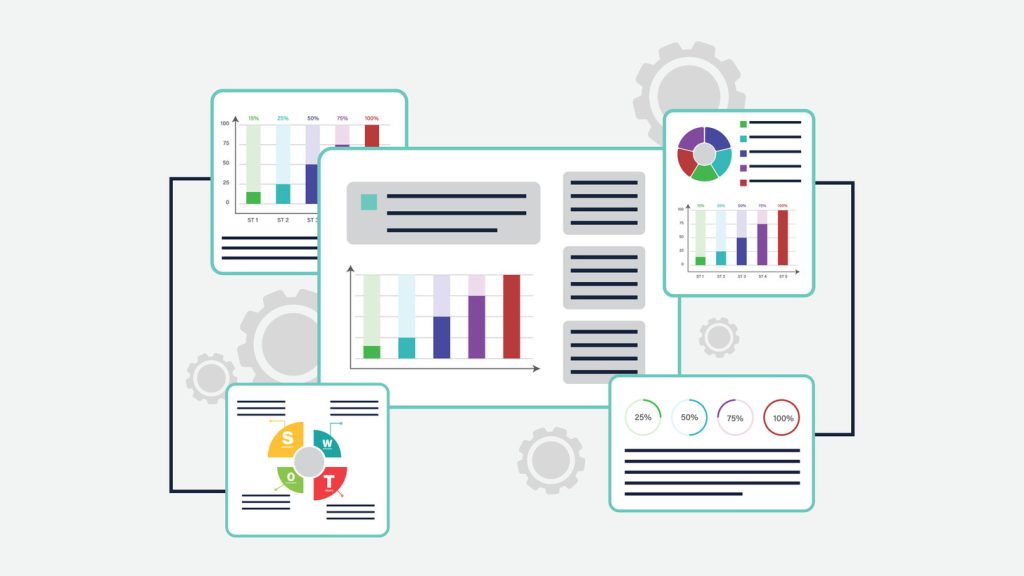
Exploring Visualization Options and Interactive Elements
Visual tools transform numbers into stories. Heatmaps expose regional sales trends at a glance, while funnel charts reveal conversion bottlenecks. Interactive dashboards let users drill into metrics by clicking elements—like viewing quarterly revenue breakdowns per product line.
Dynamic features boost engagement. Hover-over details show exact figures behind bar graphs, and layered tabs let teams compare campaign performance against budget allocations. These elements turn static tables into living documents that answer follow-up questions in real time.
| Visualization Type | Use Case | Impact |
|---|---|---|
| Geographic Heatmaps | Regional sales analysis | Identifies top-performing markets |
| Funnel Charts | Conversion tracking | Highlights drop-off points |
| Time-Series Graphs | Inventory management | Predicts seasonal demand |
Integrating Data Filters, Metrics, and Dimensions
Smart filtering eliminates noise. Dropdown menus let users isolate metrics by department, region, or timeframe. A retail chain improved stock turnover by 22% after adding supplier lead-time filters to procurement dashboards.
Effective dimension pairing reveals hidden connections. Combining customer demographics with purchase history helped one firm boost upsell rates by 17%. Tools like customer relationship workflows demonstrate how integrated filters streamline complex analyses.
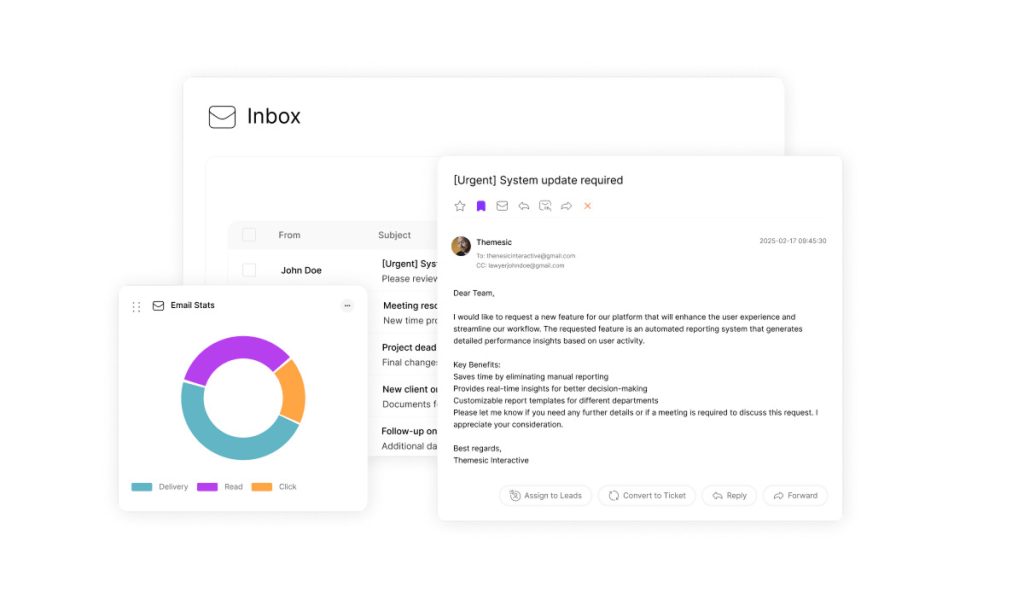
Real-time updates keep insights relevant. Automated data pulls from CRM and ERP systems ensure dashboards reflect current conditions—critical for fast-paced industries like logistics or e-commerce.
Exploring Diverse Types of Custom Reports
Organizations require distinct analytical formats to address varied operational needs. From leadership briefings to department-specific metrics, specialized formats turn data into targeted action plans. These solutions adapt to stakeholder priorities while maintaining enterprise-wide alignment.
Executive Summaries and Operational Dashboards
Leadership teams need condensed insights without technical clutter. Executive summaries distill financial trends, growth projections, and risk assessments into high-impact overviews. One manufacturing firm reduced board meeting times by 40% using visual summaries highlighting production bottlenecks.
Operational dashboards track live metrics across locations. Real-time inventory levels, order fulfillment rates, and workforce productivity updates empower managers to spot issues instantly. Color-coded thresholds trigger alerts when KPIs veer off course.
Tailored Analytics for Revenue Teams
Sales departments thrive on territory performance comparisons and lead conversion trends. Dynamic filters let teams isolate metrics by region or product line—key for refining quota strategies. Marketing groups benefit from blended engagement data showing campaign ROI alongside social media sentiment.
CRM analytics reveal customer retention patterns. Lifetime value calculations paired with support ticket histories help service teams prioritize high-value accounts. One retailer boosted repeat purchases by 19% after identifying at-risk clients through interaction frequency reports.
Governance and Technical Performance Insights
Compliance tools automate audit trails and regulatory documentation. Financial institutions use these systems to track transaction records across jurisdictions—cutting reporting errors by 32% in one case study. Risk management modules map threat likelihood against mitigation costs.
IT performance dashboards monitor system uptime and cybersecurity threats. Network latency heatmaps helped a logistics company reduce outage-related losses by $850K annually. Supply chain analytics optimize vendor lead times while predicting seasonal demand spikes.
Best Practices for Optimizing Your Reporting Process
Turning raw data into strategic action requires systems that evolve with organizational needs. Robust frameworks maintain relevance as teams scale operations and refine priorities. Three pillars drive success: error-proof inputs, adaptable architecture, and stakeholder collaboration.
Building Trust Through Reliable Data Foundations
Accurate insights start with rigorous validation. Teams implement automated checks to flag inconsistencies during data ingestion. One healthcare provider reduced billing errors by 34% after introducing real-time solutions for duplicate record detection.
Scalable systems handle growing demands without performance dips. Cloud-based products allow seamless expansion of storage and processing power. Regular audits ensure metrics align with current business objectives while maintaining historical accuracy.
Creating Feedback Loops for Continuous Refinement
User input shapes reporting tools into actionable resources. Monthly surveys and usage analytics reveal which features drive engagement. A logistics firm redesigned its dashboard layout based on driver feedback, cutting report generation time by 41%.
Iterative improvements keep solutions aligned with market shifts. Cross-functional workshops help IT and operations teams prioritize updates that address emerging challenges. Performance tracking ensures optimization efforts deliver measurable ROI across key areas.
Training programs maximize user adoption while minimizing support requests. Interactive tutorials and role-specific guides help teams leverage advanced features like predictive modeling and scenario planning.
Conclusion
In today’s landscape, in an era where data drives decisions, precision-tailored analytics separate industry leaders from competitors. Additionally, these solutions transform complex information into clear pathways for growth, aligning technical capabilities with strategic priorities. Consequently, organizations that invest in adaptable systems gain measurable advantages in operational speed and market responsiveness
Importantly, successful implementation hinges on merging technical depth with user-friendly design.
Furthermore, teams achieve this balance by prioritizing intuitive interfaces while maintaining robust data architectures. As a result, this approach ensures stakeholders at all levels extract actionable insights without specialized training.
To begin with, the future of business analysis lies in systems that evolve alongside organizational needs.
In addition, emerging tools offer predictive modeling and real-time scenario testing, empowering teams to anticipate challenges before they arise. Consequently, companies embracing these advancements position themselves for sustained excellence in fast-moving markets.
Firstly, measurable returns—from cost reductions to revenue growth—validate tailored approaches as critical assets. Moreover, beyond metrics, these frameworks foster cultures where evidence-based choices replace guesswork. Ultimately, when executed effectively, adaptive reporting becomes the cornerstone of informed decision-making across all business functions.