

 Return to
 Reporting & Analytics Tools: A vs. B Comparison Guide
Business leaders now operate in a landscape where data-driven decisions separate thriving organizations from stagnant ones. While raw numbers form the foundation of progress, the tools used to interpret them determine real-world outcomes. Choosing between solutions that prioritize basic reports versus those offering advanced insights directly impacts operational efficiency and strategic agility.
Reports compile historical facts, showing what happened. Analytics transform those facts into actionable intelligence, revealing why events occurred and predicting future trends. This distinction matters more than ever as companies balance immediate needs with long-term growth goals.
Many teams struggle with tools that generate overwhelming spreadsheets but lack predictive capabilities. Others invest in complex systems requiring specialized skills their staff doesn’t possess. The right solution bridges this gap, aligning technical functionality with organizational objectives.
This guide evaluates critical factors like data processing speed, customization options, and scalability. It examines how different platforms handle real-world scenarios – from startups managing limited datasets to enterprises processing millions of transactions. Decision-makers gain clear frameworks to identify which tool delivers measurable ROI for their unique operational demands.
Key Takeaways
- Reports summarize past events, while analytics predict trends and explain causes
- Tool selection requires balancing technical requirements with workforce capabilities
- Scalability ensures solutions grow alongside business needs
- Implementation costs extend beyond initial purchase to training and integration
- Real-world testing reveals how tools perform under operational pressure
Understanding the Landscape of Reporting & Analytics Tools
Modern organizations face a critical challenge: transforming raw numbers into strategic assets. The tools they choose determine whether teams drown in spreadsheets or unlock actionable patterns. Two forces shape this landscape – foundational data interpretation and adaptive insight generation.
An Overview of Business Decision-Making Needs
Companies no longer rely on gut feelings. Market leaders use tools that connect sales figures, customer feedback, and supply chain metrics. These systems answer urgent questions: Which products drive profits? Where are operational bottlenecks?
Effective solutions handle both instant updates and long-term trends. A retail chain might track hourly foot traffic while analyzing annual purchasing patterns. This dual focus helps teams act fast without losing sight of big-picture goals.
The Evolution from Static Reports to Dynamic Insights
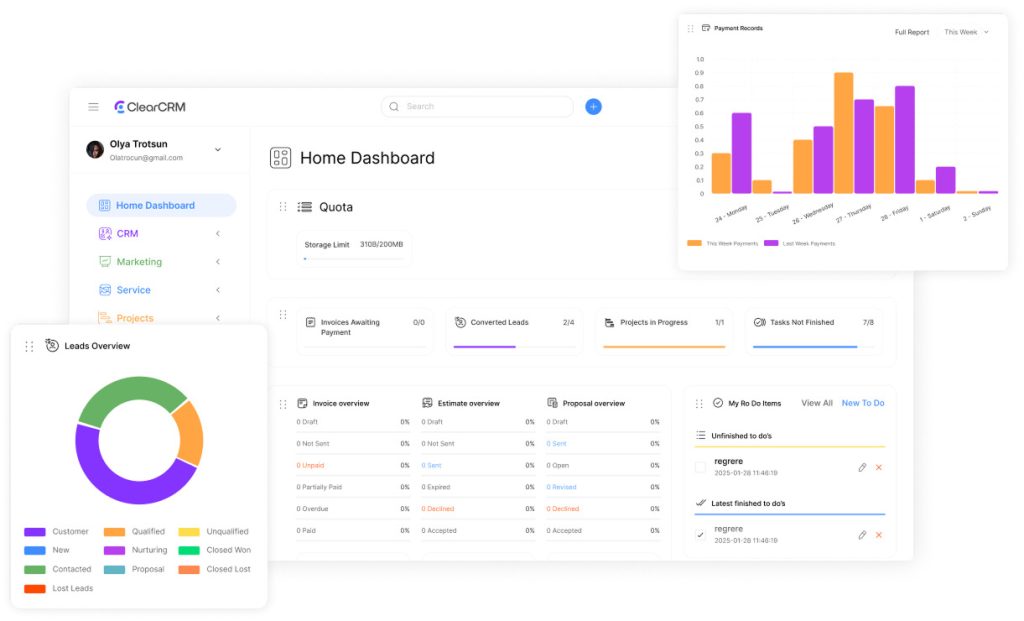
Traditional PDF summaries often gather dust. Modern platforms let users drill into charts, filter results, and test scenarios. For example, a marketing team could adjust ad spend in real time based on campaign performance.
| Feature | Static Reports | Dynamic Insights |
|---|---|---|
| Data Sources | Single system | Multiple platforms |
| Update Frequency | Monthly/Quarterly | Real-time |
| User Interaction | Read-only | Custom filters |
| Outcome | Historical record | Actionable steps |
This shift demands tools that balance security with flexibility. Financial institutions now use dashboards that update stock prices while maintaining audit trails. Such systems prevent data leaks while enabling quick decisions.
Reporting vs. Analytics: Core Differences
Operational efficiency meets strategic foresight in modern data systems. Transactional platforms excel at processing daily tasks but restrict users to fixed views. Analytical tools unlock hidden patterns through adaptive exploration, transforming raw numbers into strategic assets.
Transactional and Operational Systems
Operational platforms like HR databases or payment processors prioritize speed over flexibility. These systems store information in separate tables for rapid access during high-volume transactions. Prebuilt reports display fixed columns – sales totals per region or employee hours logged – but can’t combine datasets without custom coding.
| Feature | Operational Reports | Analytical Insights |
|---|---|---|
| Data Structure | Predefined columns | Custom dimensions |
| User Interaction | Filter existing fields | Create new metrics |
| Update Frequency | Scheduled batches | Live connections |
| Outcome | Standardized outputs | Interactive dashboards |
Static Columns vs. Dynamic Definitions
Traditional reports resemble frozen snapshots – useful for compliance but limited in scope. Analytical platforms let teams explore connections between inventory levels, customer demographics, and seasonal trends through drag-and-drop interfaces.
- Fixed frameworks require separate reports for sales by region vs product category
- Adaptive systems correlate shipping delays with weather patterns automatically
- Visual workflows replace spreadsheet exports with heatmaps and trend lines
This structural divide impacts decision velocity. Manufacturing teams using static reports might miss supply chain risks hidden across disconnected datasets. Dynamic analysis surfaces these patterns through automated alerts and predictive modeling.
Data Integration and Unified Analytics Solutions
Fragmented information systems create invisible barriers to progress. When employee records live in HR software, sales figures in CRM platforms, and logistics data in supply chain tools, teams waste hours merging spreadsheets. Unified systems dissolve these walls through automated connections.
Siloed Data vs. Unified Data Platforms
Separate systems force employees to act as data janitors – cleaning, sorting, and reconciling mismatched files. Unified platforms map relationships automatically, like linking customer support tickets to purchase histories. This eliminates manual errors and accelerates analysis cycles.
| Factor | Siloed Systems | Unified Platforms |
|---|---|---|
| Access Speed | Hours/days | Seconds |
| Error Rate | 15-20% manual entry | <2% automated |
| Security | Multiple weak points | Centralized controls |
| Scalability | Limited by spreadsheets | Cloud-native growth |
Transforming and Deriving Meaning from Data
Raw numbers gain strategic value through three actions:
- Standardization: Align metrics like revenue calculations across departments
- Enrichment: Combine sales figures with market trends for context
- Prediction: Forecast inventory needs using AI pattern recognition
Financial teams using unified tools reduce monthly close cycles by 40% on average. Retailers correlate weather patterns with stock turnover rates in real time. These capabilities turn fragmented inputs into cohesive action plans.
The Evolution of Reporting & Analytics in Business Operations
From cumbersome spreadsheets to instant dashboards, data utilization has entered a new era. Teams once spent days compiling numbers across disconnected systems. Today’s tools deliver insights before employees finish their morning coffee.
Redefining Information Workflows
Traditional processes required three-step marathons: extract figures from siloed databases, clean inconsistencies, then format results. A single error in manual entry could distort inventory forecasts or revenue projections. Finance teams often waited weeks to spot budget variances.
| Factor | Legacy Methods | Modern Systems |
|---|---|---|
| Time to Generate | 3-5 business days | 2 minutes |
| Error Rates | 12% manual input | 0.3% automated |
| User Accessibility | IT specialists only | Department managers |
| Insights Depth | Surface-level totals | Predictive trends |
Automated platforms now connect directly to CRM tools, ERP systems, and IoT sensors. Prebuilt templates transform raw figures into visual heatmaps the moment information arrives. Retail chains track shelf-stocking efficiency across 300 locations simultaneously.
Machine learning algorithms detect subtle patterns human analysts might miss. A shipping company reduced fuel costs by 18% after AI identified inefficient delivery routes. These systems require no coding expertise – users simply ask natural-language questions.
Real-time alerts notify managers when production lines slow or website traffic spikes. Marketing teams adjust campaigns hourly based on live conversion rates. This immediacy turns historical snapshots into strategic foresight.
Leveraging Reporting & Analytics for Better Decision Making
What separates successful strategies from missed opportunities? The answer lies in how organizations convert raw numbers into actionable intelligence. While reports track key metrics like sales growth or customer retention, analytics uncovers hidden patterns driving those outcomes.
Teams using descriptive reports monitor monthly performance against targets. Diagnostic tools dig deeper, revealing why a marketing campaign succeeded or why production costs spiked. This layered approach helps leaders address root causes rather than symptoms.
Advanced systems predict future trends through historical patterns. A retailer might forecast holiday demand using five years of purchase data, adjusting inventory before shortages occur. These models transform reactive guesses into proactive strategies.
- Strategic frameworks align metrics with operational goals
- Diagnostic tools pinpoint workflow bottlenecks
- Predictive models optimize resource allocation
Effective programs balance quantitative data with real-world context. A 15% revenue drop could signal market shifts or internal process flaws. Cross-functional teams combine dashboards with stakeholder feedback to identify true causes.
Governance structures ensure insights lead to results. Clear ownership of data quality and decision protocols prevents analysis paralysis. When teams trust their metrics, they act faster – turning information into competitive advantages.
Implementation Best Practices and Considerations
Implementing robust data systems requires balancing technical precision with organizational adaptability. Teams achieve maximum value when technical capabilities align with workforce skills and compliance requirements.
Key Steps for Data Collection and Preparation
Effective systems start with mapping existing information assets. A healthcare provider discovered 37% of patient records contained duplicate entries during their initial audit – a fixable issue through structured processes.
| Practice | Traditional Approach | Optimized Method |
|---|---|---|
| Data Cleaning | Manual error correction | AI-powered validation |
| Formatting | Department-specific standards | Enterprise-wide templates |
| Storage | Centralized databases | Hybrid cloud solutions |
| Access | Role-based permissions | Dynamic authorization |
Three pillars support successful preparation:
- Automated validation: Reduces human error in datasets
- Cross-team collaboration: Aligns finance, operations, and IT metrics
- Performance testing: Ensures systems handle peak loads
Ensuring Compliance and Data Privacy
Regulatory alignment isn’t optional – it’s strategic. A financial services firm avoided $2M in potential fines by implementing real-time consent tracking across their platforms.
“Privacy frameworks become competitive advantages when baked into system design from day one.”
Essential safeguards include:
- Anonymization techniques for customer behavior analysis
- Automated retention policies for expired records
- Encrypted audit trails for regulatory reviews
Regular penetration testing and employee certification programs maintain trust. Organizations combining these measures see 43% faster approval for data-driven initiatives according to industry studies.
Tool Comparison: A vs. B for Optimal Performance

Selecting the right data solution shapes operational success in measurable ways. While both platforms generate essential reports effectively, their approaches to transforming numbers into strategy differ fundamentally. Decision-makers must weigh technical capabilities against workforce readiness to maximize return on investment.
Evaluation Criteria and Metrics
Critical assessment factors include data processing speed, customization depth, and scalability potential. Systems excelling in real-time updates might lack robust security protocols. Others offering advanced predictive analytics could require extensive employee training.
Key differentiators emerge in three areas:
- Adaptive dashboards versus static report formats
- Automated trend detection against manual analysis
- Cloud-based scalability compared to on-premise limitations
Real-World Use Cases and Performance Results
Sunstate Equipment’s experience demonstrates tangible benefits. By implementing a leading people analytics tool, they reduced employee turnover by 50% through data-driven staffing adjustments. Prebuilt dashboards replaced manual reports, slashing generation time from five days to two minutes while boosting equipment utilization rates.
This case highlights how predictive capabilities transform raw data into operational improvements. Organizations achieve peak performance when tools align with specific business challenges and customer needs rather than chasing generic features.