

 Return to
 How to Use Surveys And Feedback for Business Growth
In today’s competitive landscape, collecting surveys and feedback is critical for sustainable business growth. Companies that systematically gather customer feedback gain insights that help improve customer satisfaction, refine products, and deliver exceptional service experiences. By transforming raw data from feedback surveys into actionable strategies, businesses stay ahead of shifting market demands.
Well-designed feedback surveys reduce guesswork and enable organizations to make informed decisions quickly. Analyzing responses from customers empowers teams to prioritize improvements that directly influence satisfaction levels, loyalty, and revenue growth.
Regular collection of customer feedback strengthens relationships and increases trust. Companies with proactive listening strategies report higher customer satisfaction scores, lower churn rates, and greater lifetime value. Beyond immediate problem-solving, feedback uncovers hidden opportunities for innovation and operational efficiency.
Balancing qualitative insights with quantitative metrics, like the Net Promoter Score (NPS) or Customer Effort Score (CES), provides a comprehensive view of the customer experience. Advanced analytics tools transform complex survey data into clear dashboards, helping businesses allocate resources efficiently and act faster.
Key Takeaways
- Strategic data collection improves decision-making accuracy
- Client-focused businesses achieve higher retention rates
- Balanced analysis reveals operational improvement areas
- Real-time insights accelerate product-market alignment
- Systematic listening reduces churn through proactive adjustments
Understanding the Role of Customer Feedback in Business Growth
Successful business strategies rely on direct input from customers who engage with products or services daily. Gathering insights through structured feedback surveys bridges gaps between assumptions and real-world experiences, ensuring companies make data-driven choices.
Defining Modern Insight Tools
A modern survey is more than a set of questions—it’s a strategic tool to capture the user perspective. Feedback surveys measure satisfaction levels, product usability, and service quality. Unlike generic questionnaires, they focus on specific interactions to produce meaningful data.
Driving Operational Excellence
Product teams use customer input to validate design choices and prioritize updates. Service enhancements often originate from recurring themes in client responses. Organizations tracking these patterns achieve measurable improvements in user retention and market positioning.
| Feedback Type | Primary Focus | Business Impact |
|---|---|---|
| Product Experience | Feature usability | 25% faster iteration cycles |
| Service Interaction | Support efficiency | 18% higher satisfaction rates |
| Market Positioning | Competitive alignment | 32% improved client retention |
Regular analysis of client perspectives reveals hidden opportunities for innovation. Companies that institutionalize this practice build adaptive cultures responsive to evolving demands. The result? Sustainable growth rooted in evidence rather than intuition.
Leveraging Surveys And Feedback for Enhanced Business Performance
Harnessing direct consumer insights propels companies toward measurable growth. Research reveals 62% of buyers prefer brands that value their opinions through survey participation and structured feedback channels. This approach transforms casual interactions into strategic assets that drive revenue acceleration.
Systematic feedback loops yield dual benefits: 52% loyalty increases and scalable insight generation. Well-structured survey tools require minimal upkeep while delivering continuous performance metrics. Organizations gain cost-efficient access to large customer populations without recurring expenses.
High-impact improvements emerge when teams analyze survey responses. Prioritizing changes based on verified preferences leads to 25% faster product iterations. Companies using this method report stronger market alignment and reduced resource waste.
Closed-loop feedback systems demonstrate responsiveness, boosting retention through visible adjustments. Regular analysis helps businesses track satisfaction benchmarks, achieving 32% higher customer lifetime values. These customer-focused strategies drive sustainable performance improvements across industries.
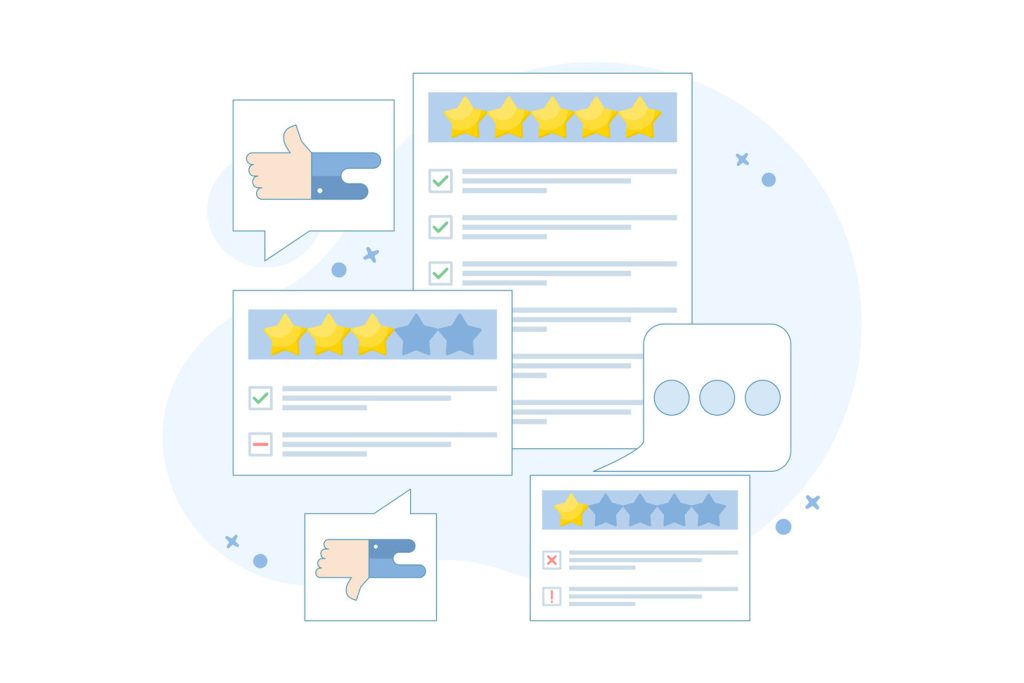
Exploring Different Types of Customer Feedback Surveys
Businesses thrive when they match data collection methods to specific operational goals. Specialized measurement tools capture distinct aspects of client experiences, enabling precise improvements across products and services.
Customer Research and Satisfaction Surveys
Customer satisfaction surveys gauge immediate reactions to transactions or feature usage. These tools typically ask users to rate experiences using simple scales. For example: “How would you rate your recent support interaction?”
Research-focused versions dive deeper into preferences and unmet needs. They help companies identify market gaps before launching new initiatives. This proactive approach reduces risk while aligning offerings with buyer priorities.
Net Promoter Score and Customer Effort Score Surveys
The net promoter score system measures loyalty through one critical question. Responses classify clients as promoters, passives, or detractors. Companies use this segmentation to prioritize retention strategies and referral programs.
Customer effort score assessments reveal friction in processes like returns or account setup. Low scores indicate areas needing simplification. Organizations addressing these pain points often see 19% faster resolution times and higher satisfaction rates.
| Survey Type | Key Metric | Optimization Impact |
|---|---|---|
| NPS | Loyalty segmentation | 27% higher referral rates |
| CES | Process efficiency | 22% reduced support tickets |
| CSAT | Transaction quality | 15% faster satisfaction growth |
Strategic deployment of multiple survey types creates layered insights. Teams combine immediate satisfaction data with long-term loyalty trends to guide resource allocation. This multi-angle approach drives measurable improvements in client retention and operational efficiency.
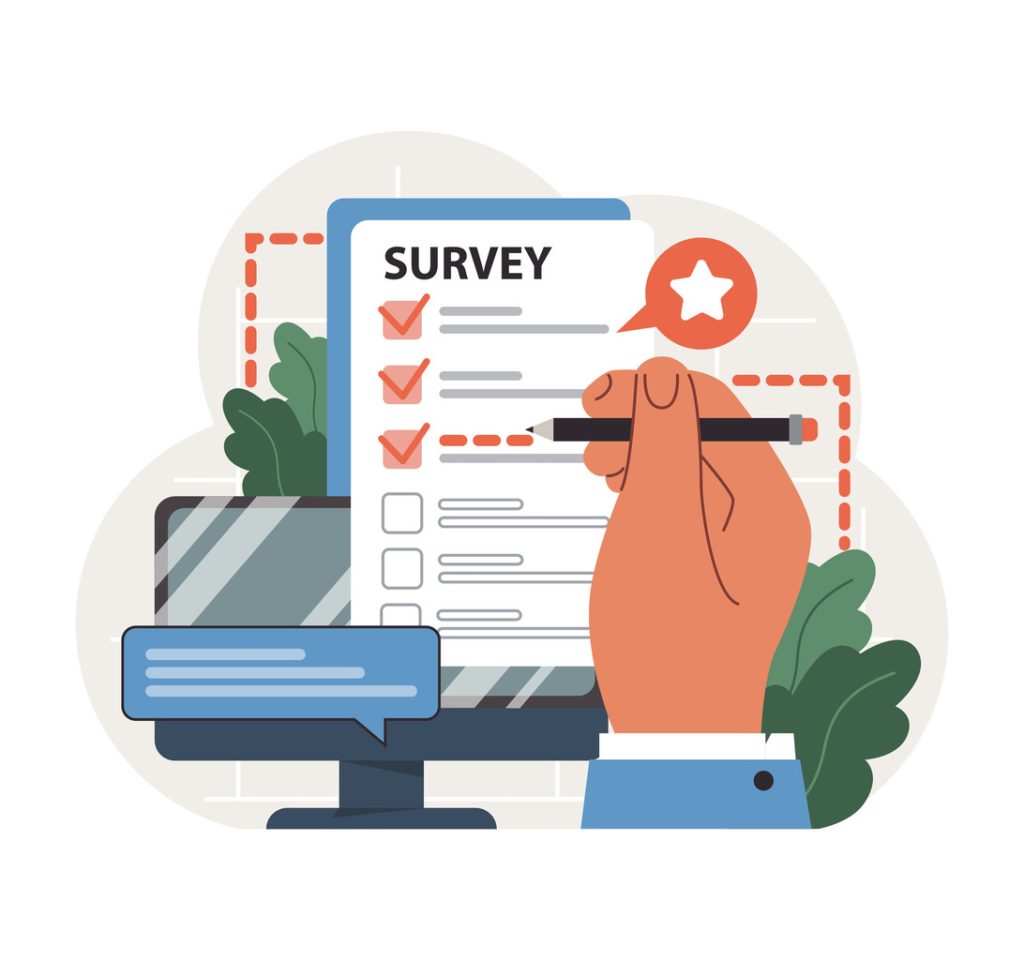
Best Practices for Crafting Effective Feedback Surveys

Crafting precise measurement instruments separates industry leaders from competitors. Organizations that master question design and platform selection gather richer insights while maintaining high participation rates. This requires balancing technical precision with psychological awareness of respondent behavior.
Designing Clear, Unbiased Questions
Effective queries avoid leading language that influences answers. Instead of “How excellent was your experience?”, neutral phrasing like “Rate your experience” yields reliable data. Double-barreled inquiries such as “Was our staff friendly and efficient?” force respondents to evaluate multiple factors simultaneously, reducing clarity.
Mixed question formats enhance response quality. Likert scales measure satisfaction intensity, while open-ended follow-ups capture specific improvement suggestions. Leading SaaS companies report 40% higher completion rates when combining both formats in two-question micro-surveys.
Selecting the Right Survey Tools
Modern platforms offer features that elevate data collection. Custom branding maintains visual consistency across touchpoints, while mobile-responsive designs accommodate 73% of users completing questionnaires on smartphones. Real-time analytics dashboards help teams spot trends as responses arrive.
Integration capabilities prove critical for scaling operations. Tools connecting to CRM systems automatically segment audiences based on purchase history or support interactions. This enables personalized question sequences that increase relevance and completion rates by 28%.
Optimizing Survey Timing and Frequency
Timing transforms raw data into strategic assets. Businesses capturing input at critical moments gain clearer insights into customer priorities. Properly timed requests yield 47% higher response rates compared to random distribution.
Triggering at Crucial Touchpoints
High-value interactions create ideal feedback opportunities. Post-purchase follow-ups within 24 hours capture fresh impressions of product quality. Service resolution surveys sent immediately after ticket closure measure support effectiveness.
Lifecycle stages dictate optimal timing. New users receive onboarding experience questions after their third login. Loyalty program members get quarterly check-ins assessing perceived value shifts.
| Touchpoint | Trigger Action | Data Impact |
|---|---|---|
| Product Returns | Post-return confirmation | 41% actionable process insights |
| Subscription Renewals | 48 hours post-payment | 33% retention predictors |
| Feature Adoption | 7-day usage milestone | 28% UX improvement signals |
Balancing Response Rates and Fatigue
Quarterly satisfaction checks maintain pulse monitoring without overwhelming participants. Automated systems enforce 90-day gaps between invitations for individual users. Cross-department coordination prevents duplicate requests across marketing, product, and support teams.
Effective programs use behavior-based triggers instead of fixed schedules. Clients interacting with new features receive targeted queries about specific updates. This approach maintains relevance while reducing overall contact frequency.
- Prioritize transaction-based triggers over calendar reminders
- Limit cross-channel requests to 2 per quarter
- Exclude recent respondents for 45 days
Analyzing and Interpreting Survey Data
Significantly, effective data interpretation transforms raw numbers into actionable strategies. As a result, businesses that master this process uncover hidden patterns that drive satisfaction and operational efficiency. Therefore, proper analysis turns collected information into clear roadmaps for improvement.
Key Metrics and Response Analysis
Start by tracking completion rates and drop-off points. High abandonment at specific questions signals confusing phrasing. Time-to-complete metrics reveal whether surveys respect participants’ schedules.
Firstly, combine numerical ratings with open-ended customer insights. Meanwhile, quantitative scores highlight trends, while qualitative comments explain why issues occur. Furthermore, advanced platforms segment survey responses by user demographics, exposing varying needs across groups.
Establish benchmarks during initial analysis. Compare future results against these standards to measure progress. Teams that track year-over-year data identify seasonal patterns and long-term improvement areas.
Implementing Data-Driven Changes
Prioritize adjustments using impact-potential matrices. Focus on changes affecting both satisfaction scores and revenue metrics. For example, reducing checkout steps might address 42% of cart abandonment complaints.
Create accountability systems with clear ownership. Designate team leads for specific improvement areas and set measurable targets. Regular progress reviews ensure insights translate into tangible results.
To begin with, close the loop by informing participants about implemented changes. As a result, this practice boosts future response rates by 31% while strengthening client relationships. Ultimately, continuous refinement cycles turn analysis into sustained growth engines.
Integrating Feedback into Your Business Strategy

Successful companies convert client voices into operational blueprints. Systematic processes turn customer insights into measurable objectives with defined ownership. This approach ensures every piece of input fuels tangible improvements.
From Data to Strategic Execution
Cross-functional teams map feedback to specific business functions. Product teams address feature requests, while service groups refine support protocols. Centralized tracking systems prevent valuable insights from slipping through organizational cracks.
Prioritization frameworks focus resources on high-impact changes. Companies assess which adjustments align with growth targets and operational capacities. Quick wins build momentum, while complex initiatives follow structured timelines.
Transparent communication completes the feedback loop. Organizations that update clients on implemented changes see 34% higher retention. Even when immediate action isn’t feasible, acknowledging input maintains trust and encourages future participation.
This cycle of listening, adapting, and informing creates self-reinforcing growth. Businesses mastering this integration outpace competitors through faster market alignment and stronger client relationships.