Survey Analytics And Reporting: How to Get Actionable Insights

Raw customer responses hold immense potential — but only when properly decoded through effective survey analytics. Modern organizations use systematic evaluation methods to transform fragmented opinions into clear pathways for growth. This process goes beyond tallying scores, revealing hidden patterns that manual reviews often miss.
Advanced techniques blend numerical metrics with contextual observations. Cross-referencing response trends with operational data helps pinpoint what truly drives client satisfaction. Companies adopting this approach consistently outperform competitors in retention rates and revenue growth.
The methodology involves multiple critical phases. Initial information gathering requires careful design to ensure relevance. Subsequent cleaning and statistical evaluation eliminate noise while highlighting significant correlations. Final presentation formats turn complex findings into executive-ready visualizations that align teams and justify investments.
Forward-thinking enterprises now prioritize this capability, recognizing its role in building customer-centric operations. When executed effectively, it creates a continuous improvement loop – identifying friction points while measuring the real-world impact of operational changes.
Key Takeaways
- Systematic evaluation converts unstructured feedback into growth strategies
- Combining numerical trends with contextual analysis reveals hidden opportunities
- Multi-stage processes ensure data accuracy and actionable conclusions
- Visual reporting bridges the gap between raw information and strategic decisions
- Ongoing analysis creates measurable improvements in customer experiences
- Advanced tools accelerate processing without compromising result quality
Introduction to Survey Analytics And Reporting
Organizations unlock their most valuable asset when they transform raw feedback into strategic roadmaps. This conversion process separates reactive companies from those shaping market trends through informed action.
Why Feedback Fuels Smart Choices
Direct input from clients reveals what spreadsheets can’t. A 2023 Forrester study found companies using structured feedback systems make decisions 47% faster than peers relying on assumptions. Key advantages include:
- Identifying unmet needs before competitors
- Prioritizing resource allocation based on verified pain points
- Measuring policy changes against actual client reactions
“Data without context is noise. When we connect response patterns to operational realities, that’s when transformation happens.”
From Numbers to Strategic Moves
Effective analysis bridges the gap between collected information and boardroom decisions. Consider this comparison:
| Data Type | Analysis Method | Business Impact |
|---|---|---|
| Quantitative ratings | Statistical correlation | Product feature prioritization |
| Qualitative comments | Sentiment analysis | Service protocol updates |
| Mixed response sets | Trend mapping | Market positioning shifts |
Leaders who master this translation see 28% higher customer retention within 18 months according to Gartner benchmarks. The process turns abstract results into concrete improvement plans – from frontline training adjustments to inventory management overhauls.
Survey Analytics And Reporting: A Comprehensive Approach

Businesses that systematically interpret client input outperform peers by 19% in customer retention. This method converts scattered opinions into targeted action plans, creating measurable improvements across operations.
How Insight Evaluation Strengthens Client Bonds
Thorough examination of response patterns reveals what customers truly value. A 2024 McKinsey study shows companies using integrated evaluation processes resolve service issues 53% faster than those using basic rating systems.
| Evaluation Focus | Relationship Impact |
|---|---|
| Response trend identification | Proactive service adjustments |
| Sentiment pattern tracking | Improved communication strategies |
| Cross-departmental sharing | Organization-wide alignment |
Effective programs follow three principles:
- Combine numerical scores with contextual observations
- Prioritize improvements showing highest satisfaction gains
- Communicate changes back to clients
“Our client renewal rates jumped 22% after implementing quarterly improvement reports based on feedback trends.”
Continuous evaluation cycles help businesses anticipate needs rather than react to complaints. This proactive stance builds trust and differentiates market leaders from followers.
Fundamentals of Survey Data Types
Effective decision-making relies on understanding diverse information categories. Organizations leverage structured classification to transform raw inputs into actionable strategies. Proper identification ensures accurate interpretation and prevents misguided conclusions.
Numbers Meet Narratives
Quantitative data delivers measurable metrics through numerical values like satisfaction scores or purchase frequencies. This type supports statistical modeling and performance benchmarking. For example, tracking NPS trends reveals long-term client sentiment shifts.
Qualitative data provides context through open-ended responses and interview transcripts. It answers “why” behind numerical patterns, exposing hidden pain points. Combining both types creates multidimensional insights.
| Data Type | Key Characteristics | Business Application |
|---|---|---|
| Categorical | Distinct groups without ranking | Customer segmentation by region |
| Ordinal | Ranked preferences/priorities | Feature importance analysis |
| Scalar | Standardized measurement scales | Service quality benchmarking |
Structured Information Frameworks
Ordinal responses reveal hierarchy in preferences through ranked choices. Categorical sorting groups demographics without implied value differences. Scalar measurements enable precise comparisons using established units.
“Mixing numerical metrics with contextual feedback helped us redesign our onboarding process. Completion rates improved 34% in six months.”
Selecting appropriate data types during survey design ensures alignment with research goals. This strategic approach minimizes analysis errors while maximizing actionable outcomes.
Designing Effective Survey Questions

Well-crafted inquiries form the backbone of meaningful data collection. Strategic question design determines whether organizations gain superficial numbers or deep operational insights. Proper structure ensures responses align with research goals while minimizing interpretation errors.
Structured vs. Exploratory Formats
Closed-ended options deliver measurable results through predefined choices. These formats excel in tracking trends across large groups. Open-ended alternatives capture nuanced perspectives that reveal unexpected opportunities.
| Question Type | Data Output | Optimal Use Cases |
|---|---|---|
| Multiple choice | Standardized metrics | Feature preference ranking |
| Text response | Contextual narratives | Service improvement ideas |
| Rating scale | Performance benchmarks | Experience quality tracking |
Crafting Precision-Driven Queries
Effective inquiries avoid leading language that skews results. Instead of “How excellent was our service?”, ask “How would you rate your experience?” This neutral phrasing yields more accurate feedback.
- Use simple vocabulary matching respondents’ knowledge level
- Limit multi-part questions to single concepts
- Test phrasing with sample groups before launch
“Our pilot testing revealed 3 ambiguous questions. Fixing them boosted response accuracy by 18%.”
Balancing structured and open formats creates complementary datasets. This dual approach enables both statistical analysis and narrative-driven improvements.
How to Analyze Survey Data Effectively

Transforming raw information into strategic assets requires meticulous preparation. Proper handling at this stage determines whether findings drive meaningful change or gather digital dust.
Preparing Your Data: Cleaning and Quality Checks
Initial processing removes noise from genuine signals. Establish clear criteria for excluding entries:
- Remove duplicate submissions using timestamp/IP checks
- Flag incomplete entries missing critical response sections
- Filter rushed completions using time-to-finish metrics
A 2024 Data Integrity Report shows companies with strict cleaning protocols achieve 31% higher accuracy in trend predictions. This foundation ensures subsequent steps build on reliable inputs.
| Cleaning Step | Common Issues Addressed | Impact on Results |
|---|---|---|
| Duplicate removal | Inflated response counts | Prevents skewed averages |
| Incomplete filtering | Partial data distortions | Ensures full-scope analysis |
| Time validation | Random answer patterns | Maintains response integrity |
Utilizing Cross-Tabulation and Segmentation for Insights
To begin with, breaking information into subgroups reveals hidden patterns. Specifically, compare purchasing habits across age brackets or service ratings by geographic regions. Significantly, this approach helped a retail chain identify a 40% satisfaction gap between urban and rural customers.
“Segmenting feedback by customer tenure exposed critical drop-off points in our loyalty program. Retention improved 19% post-adjustment.”
Effective segmentation follows three rules:
- Align groups with business objectives
- Ensure sufficient sample sizes per category
- Use visual overlays for multi-variable comparisons
These methods transform generic numbers into targeted action plans. Teams gain clarity on which demographics need attention and which policies deliver universal value.
Step-by-Step Guide to Survey Analytics And Reporting
Strategic examination processes turn scattered feedback into operational blueprints. This structured approach converts raw inputs into validated improvement plans through methodical verification stages.
Aligning Objectives With Collection Strategies
Initial phases require confirming research goals match data capture methods. Teams should verify that each survey question directly supports core business inquiries. Misaligned instruments produce misleading results.
| Research Goal | Optimal Data Type | Alignment Check |
|---|---|---|
| Feature prioritization | Ordinal rankings | Scale consistency across versions |
| Service gap identification | Text responses + ratings | Open-ended prompt positioning |
| Demographic preference tracking | Categorical filters | Response option inclusivity |
Scientific Validation Techniques
Advanced verification methods separate meaningful patterns from random noise. T-tests assess whether observed differences between groups reflect true disparities or chance variations. A retail chain used this technique to confirm regional satisfaction gaps warranted localized training programs.
| Method | Application | Business Impact |
|---|---|---|
| Regression analysis | Identifying driver factors | Resource allocation optimization |
| ANOVA testing | Multi-group comparisons | Regional strategy customization |
| Chi-square tests | Category relationships | Demographic targeting improvements |
“Implementing regression models showed us which service factors actually influence renewal rates. We reallocated 30% of our budget based on those findings.”
Structured processes prevent common analytical errors. Teams maintain focus on original objectives while applying scientific rigor. Proper training in these techniques ensures reliable, repeatable results that withstand executive scrutiny.
Advanced Tools and Techniques for Survey Analysis

Modern organizations leverage cutting-edge technologies to extract deeper meaning from customer feedback. Sophisticated platforms now convert complex datasets into visual stories while artificial intelligence deciphers nuanced human emotions in written responses.
Exploring Analytics Dashboards and Visualization Tools
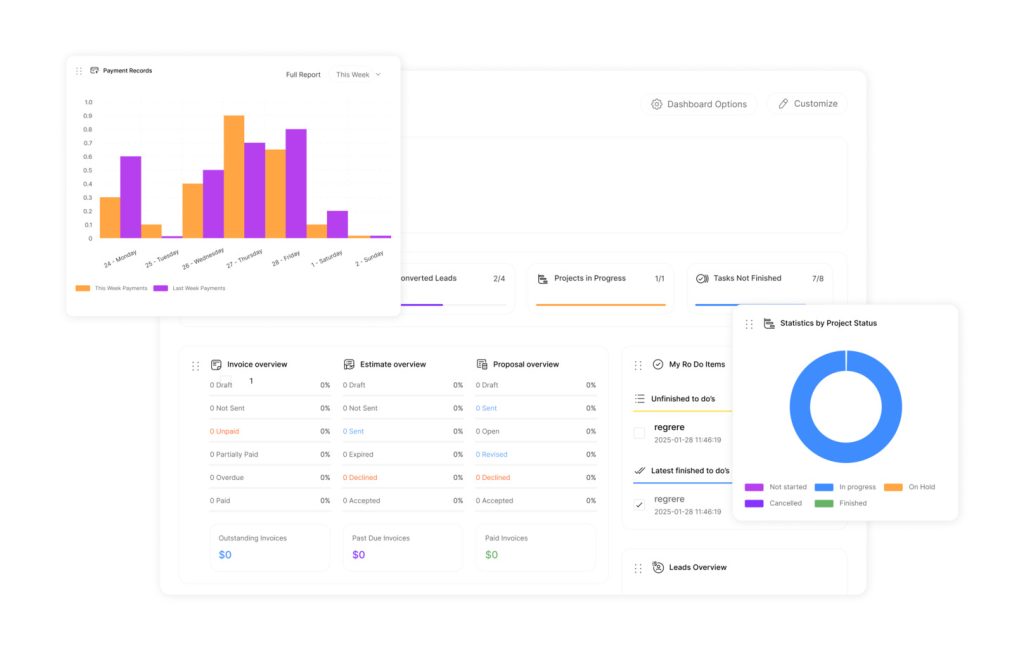
Interactive dashboards transform scattered numbers into strategic roadmaps. These solutions highlight trends through heatmaps, dynamic charts, and real-time filters – enabling teams to spot opportunities in seconds rather than hours.
| Tool Feature | Business Impact |
|---|---|
| Customizable widgets | Focus on department-specific metrics |
| Drag-and-drop builders | Rapid report customization |
| Multi-source integration | Unified customer profiles |
Leading platforms like Userpilot enable non-technical staff to create detailed performance snapshots. One logistics firm reduced meeting preparation time by 40% after implementing such systems.
AI-Driven Interpretation of Text Feedback
Natural Language Processing engines analyze thousands of comments in minutes, detecting subtle sentiment shifts manual reviews might miss. These tools categorize feedback into themes like pricing concerns or feature requests with 92% accuracy.
“Since adopting AI analysis tools, we’ve reduced feedback processing time by 60% while uncovering critical pain points our manual reviews missed.”
Key capabilities include:
- Automatic emotion scoring across response types
- Real-time alert systems for urgent issues
- Integration with CRM platforms for instant follow-ups
Common Pitfalls in Survey Analysis and How to Avoid Them

Even robust datasets become liabilities when mishandled. Analysis errors can distort findings, leading organizations toward costly missteps rather than strategic improvements. Two critical challenges demand particular attention.
Recognizing and Correcting Interpretation Biases
Analysts often unknowingly prioritize results aligning with organizational assumptions. A product team might overvalue positive feature feedback while dismissing recurring complaints about usability. This confirmation bias creates echo chambers rather than actionable insights.
Combatting this requires structured validation processes:
- Implement blind analysis where evaluators lack context about hypotheses
- Compare findings across multiple statistical methods
- Establish peer review protocols for major conclusions
Avoiding the Correlation Versus Causation Trap
Observing parallel trends doesn’t prove direct relationships. A classic example: ice cream sales and drowning incidents both rise in summer. While correlated, neither causes the other – warm weather drives both.
| Scenario | Surface Correlation | Actual Driver |
|---|---|---|
| Website traffic & sales | Higher visits = More purchases | Marketing campaign timing |
| Training hours & productivity | More training = Higher output | Employee tenure/experience |
Validating causation requires controlled testing. When a telecom company noticed higher satisfaction among users accessing tutorials, they ran A/B tests. Results proved tutorial quality – not mere access – drove improvements.
“We halted a $2M software purchase after discovering our initial correlation analysis missed key confounding variables.”
Conclusion
Strategic interpretation of customer feedback separates industry leaders from reactive competitors. When organizations implement structured evaluation processes, raw opinions evolve into growth accelerators that refine operations and deepen client trust.
Effective programs convert diverse response types into prioritized action plans. Teams gain clarity on which product updates drive satisfaction and where service enhancements deliver maximum impact. This approach transforms generic data points into targeted improvement roadmaps.
Investment in professional tools shortens analysis cycles while improving result accuracy. Automated systems process complex datasets faster, freeing teams to focus on implementation. Combined with ongoing training, these resources create self-sustaining feedback loops that anticipate market shifts.
Businesses mastering this discipline see measurable returns: higher retention rates, streamlined operations, and stronger customer relationships. The methodology turns every interaction into an opportunity for refinement, ensuring organizations evolve faster than competitors while maintaining alignment with client needs.

