

 Return to
 Optimize Workflow with Kanban View: Expert Tips

Modern teams face growing pressure to deliver results faster while managing complex projects, and a Kanban view helps visualize workflows and improve efficiency. Traditional methods often create confusion, missed deadlines, and unclear priorities. A visual workflow management system addresses these challenges by turning abstract tasks into actionable steps everyone can follow.
By organizing work into columns like “To Do,” “In Progress,” and “Done,” teams gain instant clarity on project status. This approach reduces time spent on status meetings and lets members focus on high-impact tasks. For example, tools like ClearCRM use this method to help businesses track customer interactions and sales pipelines efficiently.
Adopting this strategy improves cross-department collaboration by making responsibilities visible. Leaders quickly spot bottlenecks, redistribute workloads, and maintain steady progress. Teams using visual systems report 30% faster task completion and fewer errors caused by miscommunication.
Data-driven insights become accessible when work stages are mapped visually. Managers measure cycle times, identify recurring delays, and implement targeted improvements. These metrics create opportunities for continuous growth without overwhelming staff with complex processes.
Key Takeaways
- Visual systems transform chaotic processes into structured workflows
- Real-time progress tracking enables faster decision-making
- Clear task visibility reduces delays and improves accountability
- Cross-team collaboration strengthens through shared transparency
- Performance metrics guide measurable process improvements
Overview of Kanban Boards and Workflow Management
Historically, efficient task management strategies trace their origins to automotive manufacturing breakthroughs, inspiring what we now know as the Kanban view. Specifically, in 1963, Toyota engineer Taiichi Ohno revolutionized production lines using visual signals, a concept that evolved into the modern Kanban view to streamline part replenishment. Consequently, this process optimization method laid the groundwork for modern workflow systems, with the Kanban view now used globally to enhance productivity.
Factory Origins Shape Modern Practices
Ohno’s system used physical cards to represent inventory needs, creating instant transparency across teams. Workers identified bottlenecks faster by seeing material flow stages on factory floors. Manufacturing leaders quickly adopted these visual controls, cutting waste and boosting output by 30% within two years.
Digital Transformation Accelerates Adoption
Software teams redesigned physical tracking methods in 2006, creating shareable online boards. Cloud technology enabled real-time updates across time zones, while automation features reduced manual data entry. This shift allowed distributed teams to maintain the tactile benefits of physical systems with added scalability.
| Feature | Physical Systems | Digital Tools |
|---|---|---|
| Collaboration | Local team access only | Global real-time updates |
| History Tracking | Manual note-taking | Automatic activity logs |
| Scalability | Limited by board size | Unlimited workflows |
Early adopters in tech sectors reported 42% fewer missed deadlines after implementing digital solutions. Sales teams now track client pipelines using color-coded stages, while HR departments manage hiring processes through customizable columns. These adaptations prove visual systems work across diverse business functions.
Getting Started with Your Kanban view Board
Effective workflow management begins with translating abstract processes into visual action plans. Teams achieve this by breaking operations into distinct phases and assigning tasks to corresponding stages. This method transforms chaotic workloads into structured progress paths.
Visualizing Your Process
Start by mapping your team’s end-to-end workflow. Identify every step items take from creation to completion. Common stages include planning, development, review, and delivery. Create columns for each phase on a physical or digital board.
Color-code work items based on their type. Customer requests might use red labels, while internal projects adopt blue. This system lets teams instantly recognize task categories and prioritize accordingly. A marketing team, for instance, could track campaign launches and analytics reports through separate color lanes.
Identifying Work Items and Tasks
Analyze recurring activities to define core work types. Support tickets, product updates, and client onboarding often emerge as primary categories. Break complex projects into single-action tasks with clear completion criteria.
| Work Type | Key Attributes | Tracking Method |
|---|---|---|
| Customer Requests | Time-sensitive, external origin | Red cards, top column placement |
| Internal Projects | Multi-stage, collaborative | Blue cards with deadline labels |
| Maintenance Tasks | Routine, predictable effort | Green cards in dedicated columns |
Arrange tasks vertically within columns to show urgency. High-impact items sit above routine duties. This layout prevents critical work from getting buried under less pressing activities. Teams using this approach resolve priority tasks 40% faster according to Asana’s 2023 productivity report.
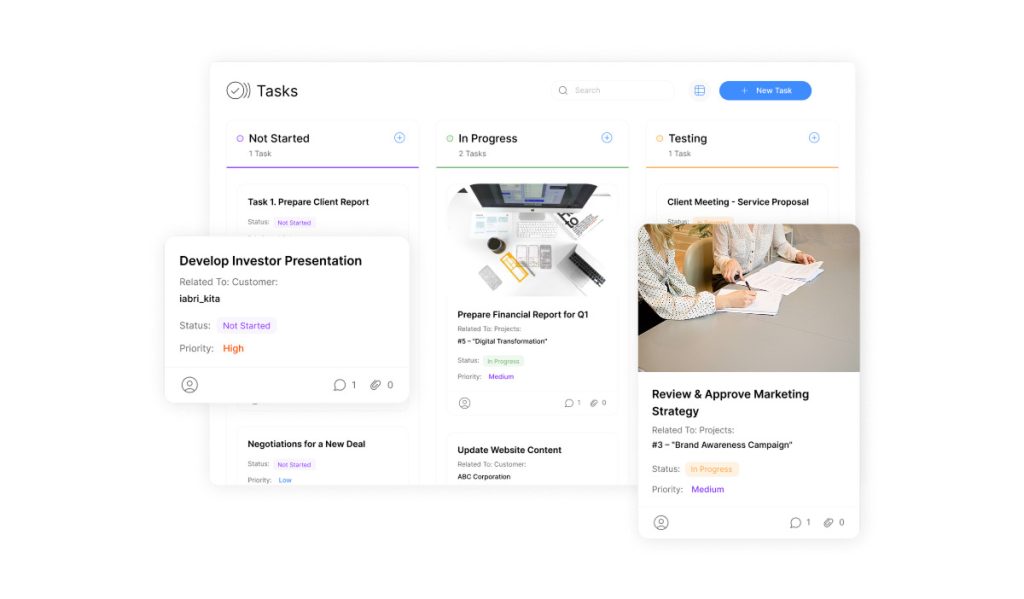
Mastering Kanban View for Workflow Optimization

Teams achieve peak efficiency when they transform complex processes into intuitive visual layouts. Modern interfaces convert data-heavy workflows into dynamic systems where progress becomes tangible and actionable.
Navigating Task Management Interfaces
Work items appear as cards displaying essential details like deadlines and stakeholders. These movable elements let teams track progress through color-coded lanes representing distinct process phases. Sales pipelines might use stages like “Lead Qualification” or “Contract Finalization” as vertical columns.
Managers instantly assess workloads through lane headers showing:
| Stage | Revenue Potential | Active Items |
|---|---|---|
| Prospecting | $420,000 | 12 |
| Negotiation | $185,000 | 6 |
Dragging cards between lanes updates real-time metrics, helping teams prioritize high-value tasks. Systems initially display 10 items per lane to prevent overload, with scrolling options for full visibility. This balance maintains focus while preserving access to complete datasets.
Advanced filtering lets leaders isolate specific work types or analyze trends across departments. A marketing director might search all “Campaign Launch” cards to assess resource distribution. These features enable swift bottleneck identification without disrupting team workflows.
Organizations using visual interfaces report 28% faster project cycle times according to 2023 data from Forrester Research. The immediate visibility into status changes and revenue projections empowers data-driven adjustments across business units.
Best Practices for Implementing Kanban View
Successful workflow optimization requires strategic planning and adaptable structures. Teams achieve peak performance by aligning visual tools with their operational reality rather than forcing rigid frameworks. Begin with existing processes your group understands deeply, then refine through incremental adjustments.
Setting Up Columns and Swimlanes
Map current workflows using columns that mirror actual task progression. A software development team might use stages like “Backlog” → “Code Review” → “Testing” → “Deployment”. Horizontal swimlanes separate work types effectively:
| Swimlane Type | Purpose | Example |
|---|---|---|
| Priority Levels | Differentiate urgent vs routine tasks | Red lane for client escalations |
| Departments | Track cross-functional collaboration | Marketing vs engineering streams |
| Project Types | Separate initiatives by scope | New features vs bug fixes |
Limit initial columns to 5-7 stages to prevent complexity. Teams using this approach reduce setup time by 35% compared to over-engineered boards.
Establishing WIP Limits and Feedback Loops
Prevent overload by cactive work items per stage. A customer support team might allow 3 open tickets per agent in the “Resolution” column. Key implementation steps:
- Set initial limits at 50% of current capacity
- Review throughput metrics weekly
- Adjust thresholds quarterly based on velocity data
Schedule biweekly reviews to analyze bottlenecks and update policies. Teams maintaining these practices improve cycle times by 22% within three months. As one operations manager noted: “Visual constraints transformed our chaos into predictable delivery.”
These methods create living systems that evolve with organizational needs while maintaining clarity. The true power of visual management emerges when teams own their process design.
Advanced Techniques in Kanban view Management
Mature teams unlock greater efficiency by refining their visual systems through precision customization. Strategic adjustments to card layouts and movement rules transform static boards into dynamic decision-making engines.
Tailoring Information Display
Power users optimize card fields to show mission-critical data like deadlines, revenue impact, and task owners. A sales team might configure cards to display:
| Field | Basic Layout | Advanced Layout |
|---|---|---|
| Priority | Text label | Color-coded urgency indicator |
| Progress | Checkbox completion | Time-tracking bar with % complete |
| Dependencies | None shown | Linked card indicators |
Inline editing capabilities let teams update three key fields directly from cards. This eliminates disruptive context-switching between boards and forms. “Custom fields cut our update time by half,” notes a tech project lead at a Fortune 500 company.
Advanced filtering creates focused views for specific analyses. Search functions locate cards across multiple workflows using keywords or custom tags. When users switch perspectives, the system automatically filters cards based on pre-set rules.
Movement automation triggers actions when dragging cards between lanes. Transferring a task to “Quality Review” might:
- Notify QA team members
- Start a 48-hour timer
- Lock editable fields
These features maintain process integrity while enabling fluid adjustments. Teams implementing these strategies report 35% fewer status update meetings according to 2024 workflow analytics.
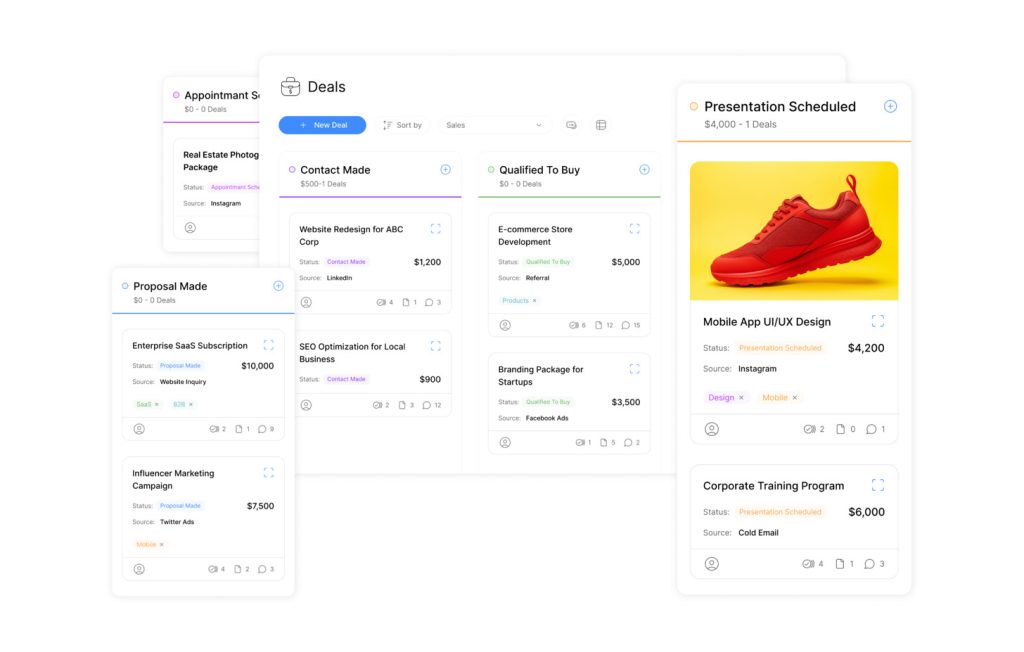
Using Kanban Board in Sales and Project Management
Sales teams require clear visibility into deal progression to maintain momentum and meet targets. Visual workflow systems transform scattered opportunities into structured pipelines, enabling real-time adjustments and strategic forecasting.
Opportunity Tracking Made Actionable
Modern sales departments use kanban boards to map customer interactions from first contact to contract closure. Each card represents a potential deal, moving through stages like “Qualification” and “Negotiation.” Color-coded lanes highlight stalled deals, while automated alerts notify teams about expiring follow-ups.
| Pipeline View | Key Benefit | Data Points Tracked |
|---|---|---|
| Status-Based | Quick performance assessment | Open/Won/Lost ratios |
| Process Flow-Based | Methodology alignment | Stage duration, conversion rates |
Revenue forecasts improve when managers see total deal values per column. Teams identify bottlenecks faster – deals lingering in “Proposal Sent” for 10+ days trigger immediate outreach strategies.
Transparent Processes Build Client Trust
Shared pipeline visibility aligns sales and leadership teams on priorities. When marketing and account management access the same board, collaboration replaces siloed efforts. One SaaS company reduced deal slippage by 18% after implementing this approach.
Real-time metrics empower data-driven decisions. Managers analyze average stage durations to refine sales playbooks. “Seeing all opportunities in one place helped us reallocate resources before quarters ended,” notes a regional sales director at TechBridge Inc.
“Visual pipelines cut our internal status meetings by half while improving forecast accuracy.”
Consistent processes emerge when teams standardize stages across regions. Customizable fields maintain flexibility for unique client needs without sacrificing structure. This balance drives repeatable success in dynamic markets.
Leveraging Digital Tools for Kanban Efficiency

Businesses now harness intelligent platforms to transform traditional workflow systems into dynamic engines for growth. These solutions merge time-tested visual principles with cutting-edge automation, creating adaptable frameworks for modern teams.
Smart Integration Strategies
Leading platforms like Trello and Hygger offer specialized features that adapt to diverse operational needs. Teams configure boards to mirror their unique processes while maintaining core visual management benefits. For example:
| Tool | Key Strength | Best For |
|---|---|---|
| JIRA | Advanced reporting | Tech teams |
| Trello | User-friendly interface | Cross-functional groups |
| Airtable | Data-rich cards | Detail-oriented workflows |
Airtable’s approach demonstrates how teams maintain granular task details without cluttering their visual workspace. Users enter specifications in backend fields while boards display only essential progress markers.
Automation transforms static systems into responsive partners. When tasks move between stages, tools can:
- Alert stakeholders via integrated apps
- Update linked databases automatically
- Generate real-time performance dashboards
“Our approval process accelerated by 40% after implementing trigger-based notifications,” shares a project manager at logistics firm ShipRight. These intelligent features reduce manual oversight while maintaining process integrity.
Strategic tool selection remains critical. Organizations evaluate scalability needs and integration capabilities before committing. The right platform grows with teams, offering customizable fields and API connections that adapt to evolving challenges.
Conclusion
Organizations that master visual workflow systems gain measurable advantages in speed and strategic alignment. Teams convert chaotic processes into structured action plans through dynamic boards, maintaining focus on high-impact objectives. The kanban board becomes a living blueprint for operational excellence, adapting as priorities shift.
Leaders achieve three critical outcomes using these methods. Real-time visibility eliminates guesswork in task allocation. Automated tracking reduces administrative burdens while preserving accountability. Scalable frameworks support growth without sacrificing team agility.
For optimal results, start small and expand gradually. Begin with core workflows like sales pipelines or project timelines. Refine column structures based on performance data, ensuring the system evolves with organizational needs. Digital tools amplify these benefits through integrations that sync updates across platforms.
The true power of visual management lies in its simplicity. Clear lanes, color coding, and progress markers create shared understanding across departments. Teams using kanban view principles report 27% faster decision-making and 19% higher customer satisfaction scores within six months.
Continuous improvement becomes instinctive when progress is tangible. Regular reviews of board metrics uncover opportunities to streamline handoffs and eliminate redundancies. This approach transforms workflow optimization from a project into a sustainable competitive advantage.