

 Return to
 The Ultimate Guide to Behavioral Tracking And Analytics
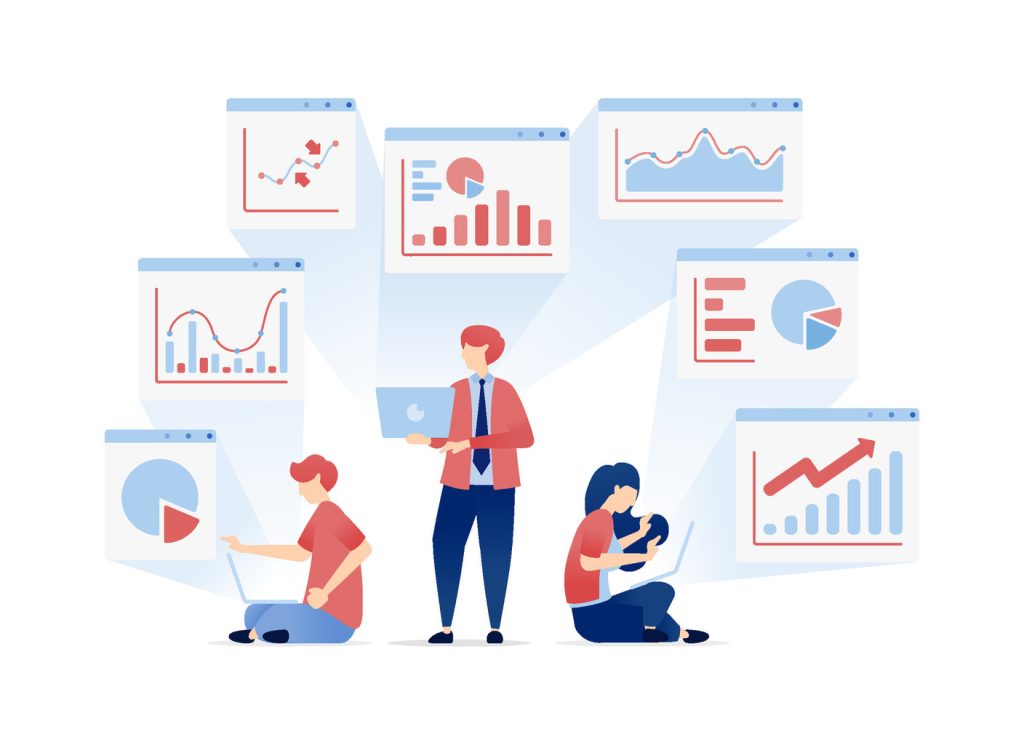
Understanding how customers interact with digital platforms is crucial for modern businesses, and tracking and analytics make these insights possible. Traditional metrics like page views only scratch the surface. By analyzing deeper patterns—such as navigation paths, scrolling behavior, and click heatmaps—companies unlock actionable insights into what drives user decisions.
Research from McKinsey reveals that organizations using these methods achieve 85% higher sales growth and 25% greater profit margins than their competitors. This approach shifts the focus from simply understanding “what happened” to uncovering “why it happened,” revealing hidden opportunities to improve user experiences and increase conversions.
Effective strategies require tools that map every interaction, from mouse movements to the time spent on specific elements. These data-driven techniques help predict future actions, enabling businesses to tailor content, resolve friction points, and prioritize the features that matter most. For example, tracking how visitors abandon shopping carts or navigate menus can directly inform redesigns that improve retention.
This guide offers step-by-step frameworks for implementing these solutions while ensuring compliance with privacy standards. Learn how industry leaders transform raw interaction logs into competitive advantages, ensuring that every decision aligns with actual customer needs.
Research from McKinsey Key Takeaways
- Businesses using advanced interaction analysis outperform peers by 85% in sales growth.
- Focus on “why” users act—not just “what” they do—drives meaningful improvements.
- Heatmaps and path tracking reveal hidden barriers in digital experiences.
- Predictive models help anticipate customer needs before they churn.
- Privacy-compliant strategies balance data collection with user trust.
Overview and Introduction to Tracking and Analytics
Modern enterprises thrive by interpreting digital interactions beyond basic metrics. While page views show activity, they miss why users act. This gap fuels demand for deeper analysis methods that reveal decision-making patterns.
Defining Modern Interaction Analysis
Interaction analysis examines actions like clicks, scrolls, and navigation paths. Unlike demographic profiles, it answers critical questions: Which features attract attention? Where do visitors abandon processes? What triggers final purchase decisions?
| Data Type | Focus | Insights Generated |
|---|---|---|
| Interaction Data | User actions (clicks, time spent) | Identifies friction points and preferences |
| Demographic Data | Age, location, job title | General audience segmentation |
“Companies that map user journeys outperform competitors by 40% in retention.”
Strengthening Business-Customer Bonds with Tracking and Analytics
Detailed interaction records help businesses predict needs. For example, noticing users repeatedly adjusting filters before purchasing reveals interface design flaws. Fixing these issues builds trust and loyalty.
Personalized experiences emerge when companies group audiences by actions rather than age brackets. A financial app might prioritize mobile optimization after discovering 80% of trades occur via smartphones. This action-first approach drives conversions.
Understanding Behavioral Tracking and Analytics
Digital platforms generate mountains of information. Traditional tools like Google Analytics offer surface-level stats—pageviews, exits, and session durations. But these metrics miss the story behind user decisions.
What Defines Action-Based Tracking and Analytics?
Action-based analysis focuses on granular events: cursor hovers, scroll depth, and button clicks. Unlike aggregated reports, it captures how individuals navigate apps or websites. For example, repeated clicks on non-responsive elements signal design flaws needing urgent fixes.
| Feature | Traditional Tools | Action-Based Tools |
|---|---|---|
| Data Type | Averaged metrics | Individual session details |
| Focus | What happened | Why it happened |
| Use Case | Monthly traffic reports | Real-time UX optimization |
How It Complements Standard Metrics
Platforms like Google Analytics excel at measuring traffic sources. Action-based methods fill gaps by showing how visitors interact with specific features. One e-commerce brand discovered 62% of mobile users abandoned carts due to hidden shipping costs—a problem invisible in bounce-rate data.
Implementing these solutions requires specialized codes. These scripts track micro-events, from hesitation patterns to rage clicks. Businesses then prioritize fixes that directly impact conversions. For a step-by-step guide to deploying these tools, explore CRM-driven marketing strategies.
Fundamental Concepts of User Behavior Data with Tracking and Analytics
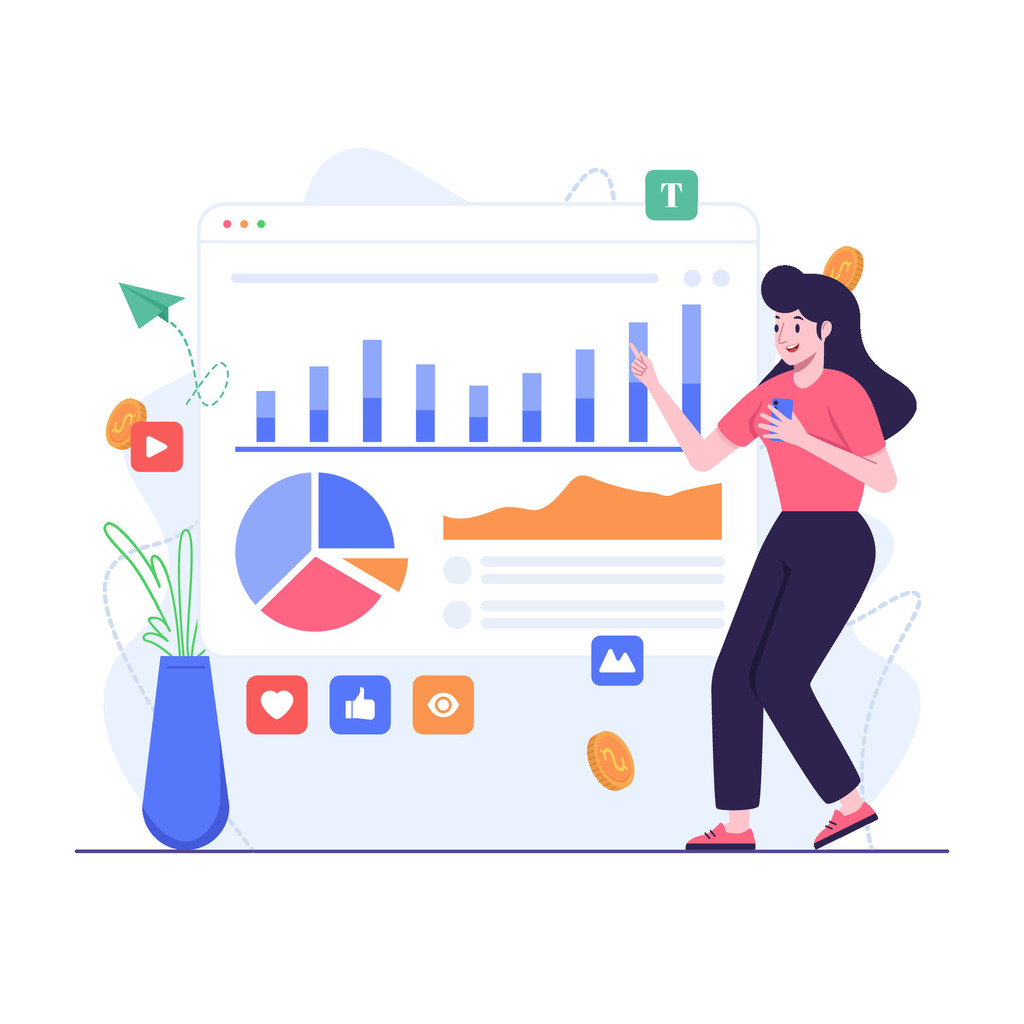
Digital success hinges on understanding the story behind every click, scroll, and pause. Five core data types transform raw interactions into strategic insights. Together, they reveal why users stay engaged or abandon processes.
Types of Data Captured and Their Significance
Click tracking exposes which elements drive decisions. For example, repeated taps on non-responsive buttons signal design flaws needing fixes. This action-focused approach identifies rage clicks—moments where frustration impacts conversions.
Cursor movements mimic eye-tracking patterns. Heatmaps show where attention lingers or skips entirely. A financial firm discovered 37% of mobile users missed critical forms hidden below fold lines.
Scroll depth data answers a vital question: Do visitors reach key content? If 90% abandon before product details, redesigns become urgent. One e-commerce brand boosted sales by 22% after relocating CTAs based on this metric.
| Data Type | Business Impact |
|---|---|
| Navigation Paths | Identifies skipped pages or features |
| Feedback Tools | Captures direct pain points in users‘ words |
Journey mapping connects these data points. Seeing how customers hop between pages exposes broken workflows. A travel site reduced booking drops by 18% after simplifying a 6-step process to 3.
“Combining scroll maps with session recordings cut our bounce rate by 30% in eight weeks.”
Surveys add qualitative context to quantitative behavior patterns. When 62% of respondents cited confusing filters, an apparel retailer revamped its search UI—lifting conversions by 14%.
These data types form a complete picture of digital experiences. They turn vague guesses into targeted fixes that retain customers and drive growth.
Exploring Tools and Techniques
Actionable insights demand precise instruments. Four specialized solutions bridge the gap between raw interactions and strategic improvements. Each serves distinct purposes but works best when combined.
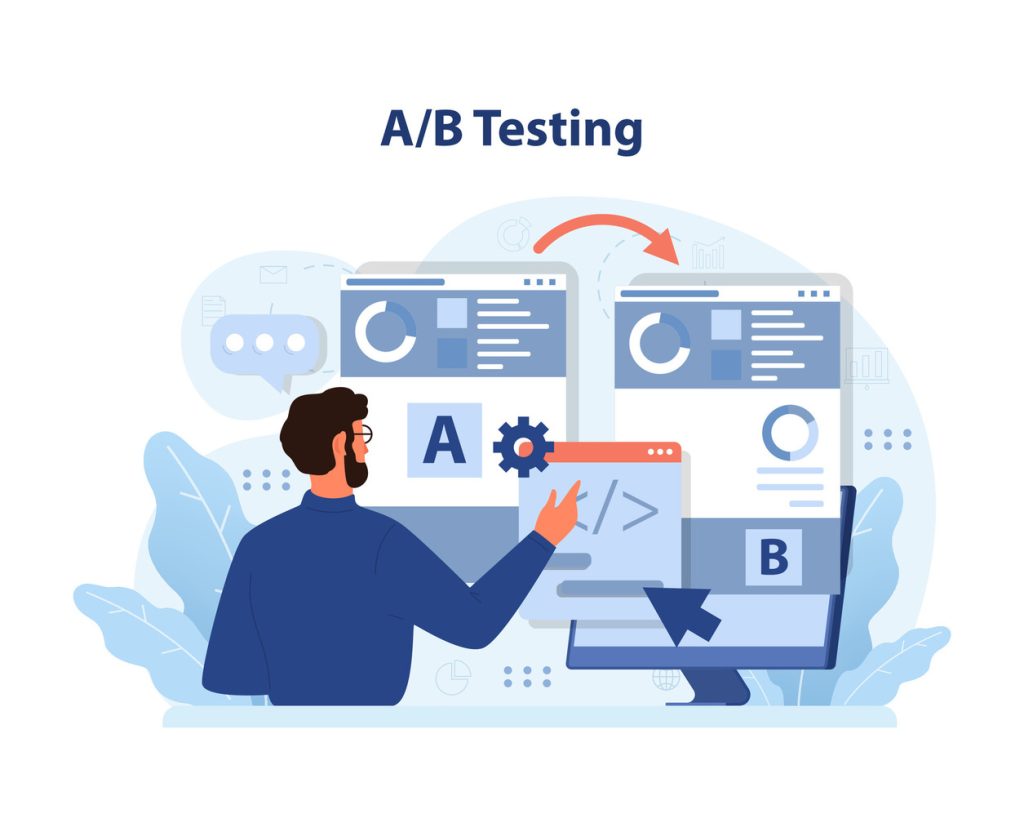
Implementing A/B Testing and Session Replay Tools
A/B testing tools let teams compare webpage variations scientifically. For example, changing button colors or form lengths reveals which versions boost conversion rates. One SaaS company increased sign-ups by 19% after testing simplified pricing tables.
Session replay tools capture real visitor journeys. These recordings expose friction points like repeated clicks on non-functional elements. Retailers often discover checkout errors invisible in standard reports—saving months of guesswork.
| Tool Type | Primary Use | Implementation |
|---|---|---|
| A/B Testing | Optimize design elements | JavaScript integration |
| Session Replay | Identify UX breakdowns | Shopify/WordPress plugins |
Leveraging Heatmaps and Voice of Customer Methods
Heatmap tools visualize engagement through color gradients. Warm zones show popular sections, while cool areas indicate ignored content. A media site relocated ads after discovering 68% of mobile users never scrolled past mid-page.
Voice of customer feedback tools add qualitative depth. In-page surveys catch frustrations in real time. One fintech firm used CSAT scores to prioritize feature updates, reducing support tickets by 32%.
“Combining heatmaps with session replays helped us fix a $2M annual revenue leak in three weeks.”
Implementation typically involves adding tracking codes via Google Tag Manager. Most platforms offer step-by-step guides for non-technical teams. Regular audits ensure data accuracy as sites evolve.
Leveraging Behavior Analytics for Enhanced User Experience
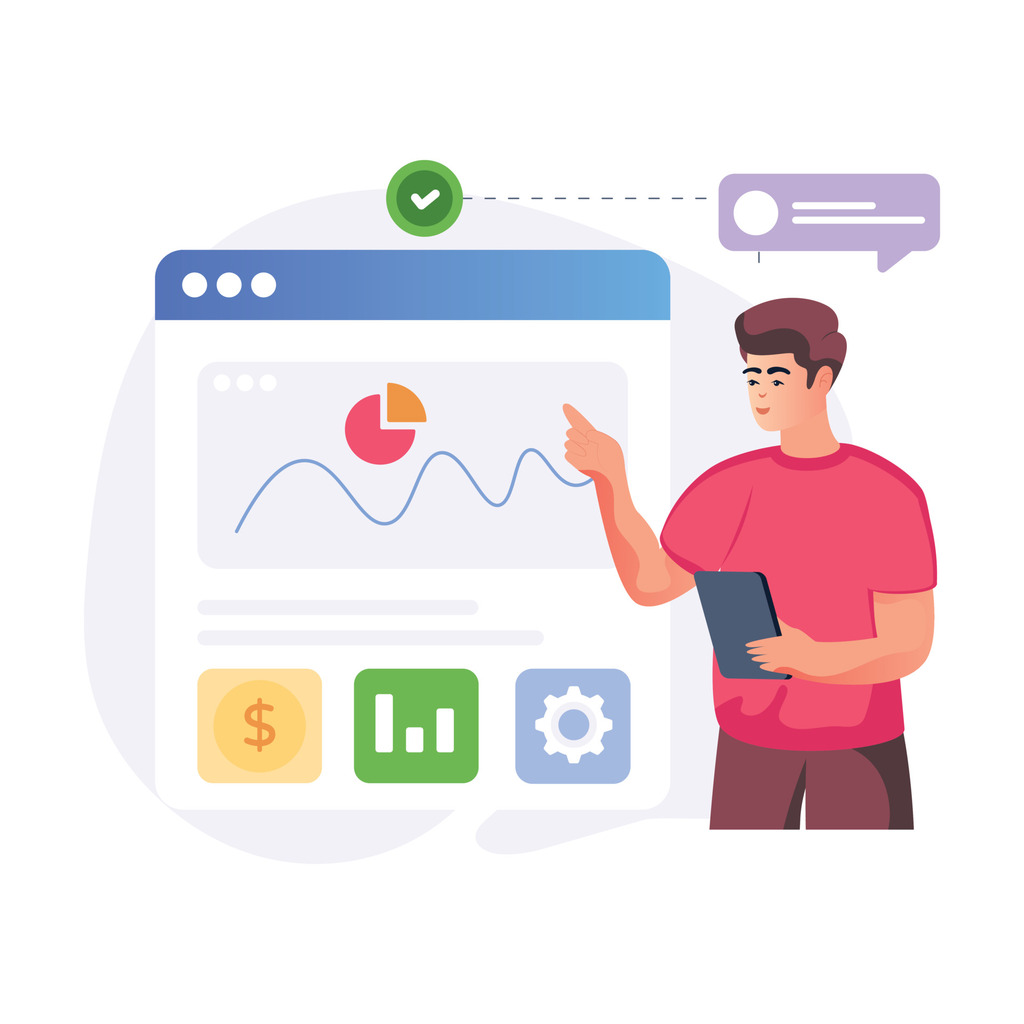
The true power of user data lies in its ability to expose invisible barriers. By analyzing how visitors engage with digital interfaces, businesses can pinpoint exactly where experiences break down—and deploy targeted fixes that drive measurable results.
Four Pathways to Experience Optimization
- Uncover hidden blockers: Identify elements like broken buttons or confusing forms that halt conversions.
- Map attention patterns: Heatmaps reveal which sections users ignore versus areas that spark engagement.
- Capture instant feedback: Trigger surveys when visitors linger on pages or abandon carts to understand why.
- Build consensus for change: Session recordings provide visual proof of UX issues that spreadsheets can’t convey.
One SaaS company used scroll-depth analysis to discover 68% of mobile users never saw their pricing table. After redesigning the layout, mobile sign-ups increased by 19% in six weeks.
“Session replays showed users scrolling past our CTA five times before converting. Simplifying the page structure boosted conversions by 11%.”
These methods work best when paired with tools that streamline workflows. Zenprint’s 7% reduction in drop-offs came from fixing pricing table errors visible only through interaction analysis.
Teams should prioritize changes impacting the conversion rate most. Regular A/B tests ensure updates align with actual user preferences rather than assumptions.
Real-World Applications and Business Impact of Tracking and Analytics
Practical results prove the value of customer journey insights. Across industries, companies use interaction data to solve tangible problems—from abandoned carts to confusing app interfaces. These examples show how strategic analysis drives measurable outcomes.
Case Studies: From Insights to Action
Zenprint discovered pricing tables caused 7% fewer drop-offs after heatmap analysis revealed overlooked design flaws. By relocating key elements, conversions rose 2% within weeks. Their approach combined session replays with A/B testing to validate changes.
Razorpay took a different path. When redesigning dashboards, they tested prototypes with 10% of users. Continuous feedback loops helped refine features, boosting satisfaction scores from 6.2 to 8.7. Each iteration addressed specific pain points like navigation delays or unclear labels.
“Seeing how users struggled with our old interface was eye-opening. Data doesn’t lie—it showed exactly where we needed to simplify.”
McKinsey research supports these methods. Organizations prioritizing customer journey data achieve 85% higher sales growth than peers. They also maintain 25% better profit margins by aligning features with user needs.
- E-commerce: Heatmaps exposed hidden shipping cost confusion, reducing cart abandonment by 14%
- Fintech: Session recordings helped streamline mobile trading flows, cutting support tickets by 32%
- SaaS: Scroll-depth analysis guided layout changes that increased sign-ups by 19%
These successes share three traits: identifying friction through data, testing solutions in phases, and measuring impact against clear business goals. Whether optimizing apps or social media campaigns, the process remains consistent—observe, adapt, and validate.
Conclusion
In today’s digital landscape, every click tells a story. Businesses that decode these narratives gain unmatched clarity into what drives customer decisions. By focusing on data-backed patterns—like scroll depth or rage clicks—companies transform vague assumptions into precise upgrades.
Heatmaps and session recordings reveal hidden friction points. These tools show why 62% of mobile users abandon forms or how menu layouts confuse first-time visitors. Addressing these issues directly improves product experiences while respecting privacy standards.
The most successful teams use these insights to prioritize changes with measurable impact. Whether optimizing a checkout page or refining an app interface, action-driven strategies outperform guesswork every time. Real-world results—like 19% higher sign-ups or 32% fewer support tickets—prove this approach works.
Forward-thinking organizations don’t just collect information. They turn it into competitive fuel, building customer loyalty through seamless digital journeys. The path to growth starts with understanding the signals hidden in every interaction.