

 Return to
 Effective Campaign Management Dashboard Solutions
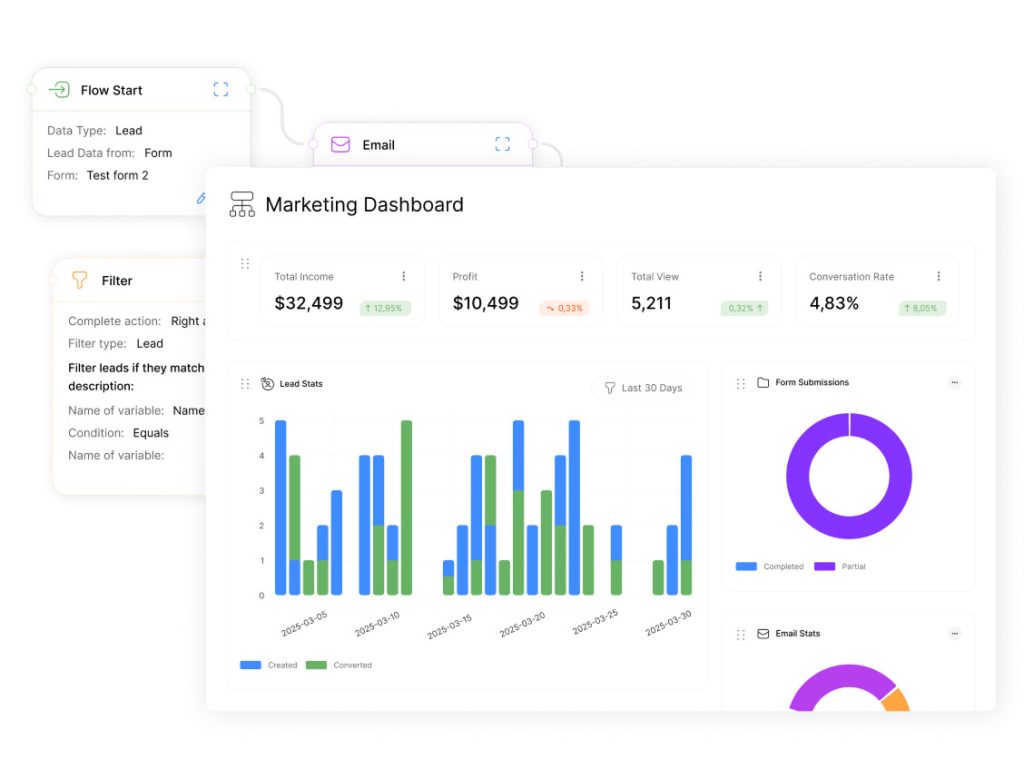
Businesses today face growing pressure to monitor advertising efforts across dozens of platforms, which is why a management dashboard has become indispensable. From Google Ads to social media promotions, fragmented data creates inefficiencies. A unified dashboard solution solves this challenge by merging metrics into one intuitive interface.
These tools eliminate the need to juggle multiple reports. Teams gain real-time visibility into paid search results, Facebook ad conversions, and cross-channel engagement. This consolidation helps identify top-performing strategies faster while reducing errors from manual data entry.
Advanced platforms transform raw numbers into visual insights. Decision-makers can compare ROI across channels, adjust budgets instantly, and forecast trends. Such agility is critical in fast-paced digital marketing environments where delays cost revenue.
Key Takeaways
- Centralized interfaces simplify tracking for Google Ads, social ads, and other platforms
- Real-time performance updates enable quicker strategy adjustments
- Consolidated data reduces errors and manual reporting workloads
- Visual analytics help teams prioritize high-impact marketing activities
- Cross-channel insights improve budget allocation and campaign outcomes
Introduction to Effective Campaign Management Dashboard Solutions
Modern teams juggle dozens of advertising accounts, from search engines to social networks. A centralized tracking system cuts through the chaos by merging scattered metrics into clear visual reports. These platforms turn fragmented numbers into actionable insights that drive smarter decisions.
Overview of Dashboard Capabilities
Advanced tools track paid ads, email opens, and SEO rankings in one place. They connect to platforms like Google Ads and TikTok Business, showing real-time results across channels. Custom filters let teams focus on metrics that matter most—like click costs or conversion rates.
Automated updates replace manual spreadsheets. Alerts flag underperforming ads instantly, while color-coded charts highlight trends. Users build custom reports in minutes, sharing progress with stakeholders through branded templates.
Why Centralization Matters
Separate platforms create conflicting data stories. One system shows Facebook leads spiking while another reports drop-offs. Unified tools fix this by syncing numbers across every channel. Teams spot true performance patterns without guessing which stats are accurate.
Time savings add up quickly. Marketers reclaim hours once spent logging into multiple accounts. They redirect energy toward optimizing bids or testing new ad formats. Consistent data streams also improve client trust during strategy reviews.
Leveraging the Management Dashboard for Campaign Success
Multi-channel strategies demand tools that connect effort to outcome. A unified interface transforms scattered metrics into strategic clarity, showing exactly how tactics drive growth. This approach turns complexity into actionable insights for teams and stakeholders alike.
Scope of Services
Advanced platforms track paid ads, organic traffic, and audience behavior across channels. They reveal which efforts generate leads versus those draining budgets. One marketing analytics solution, for example, reduces guesswork by aligning data with business goals.
Key features include:
- Cross-platform performance comparisons using live data feeds
- Audience segmentation tools that identify high-value demographics
- Automated alerts for sudden metric shifts or budget thresholds
“Transparency builds trust. When clients see real-time results mapped to their objectives, collaboration improves.”
| Service Feature | Business Impact | Client Benefit |
|---|---|---|
| Audience Analysis | 28% higher conversion rates | Clear demographic targeting |
| ROI Tracking | 19% faster budget decisions | Transparent spend justification |
| Competitor Benchmarks | 35% quicker strategy pivots | Market-aware adjustments |
Teams using these systems report 40% less time reconciling data across platforms. Real-time visualizations make quarterly reviews dynamic rather than retrospective. Decision-makers gain confidence when every dollar’s impact becomes measurable.
The right tool turns information overload into prioritized action steps. It’s not just about numbers—it’s about proving value through undeniable connections between effort and outcome.
Key Benefits of Integrating a Unified Management Dashboard
Marketing teams need instant access to performance metrics without drowning in spreadsheets. A consolidated reporting system bridges this gap by turning scattered numbers into strategic clarity. Centralized platforms eliminate version conflicts while delivering accurate snapshots of progress.
Always-On Performance Visibility
Live tracking updates remove guesswork from daily operations. Teams spot trending keywords or sudden click-through drops as they happen. This immediacy lets marketers adjust bids or pause underperforming ads before budgets bleed.
Automated reports replace manual data stitching. Platforms like ClearCRM’s unified marketing analytics solution sync metrics from Google Analytics and LinkedIn Ads into shareable formats. Errors from copy-paste workflows vanish, freeing 12+ hours monthly for strategic work.
Client Trust Through Transparency with a Management Dashboard
Automated dashboards turn raw stats into client-ready stories. Customizable templates showcase ROI trends and audience engagement without technical jargon. One agency reduced client meeting prep time by 65% using branded report automation.
“Transparency drives retention,” notes a client success director at a 50-person firm. “When clients see their goals mirrored in real-time charts, skepticism turns into collaboration.”
- Shared access ensures teams debate strategies using identical numbers
- Permission controls let clients view specific metrics without overwhelming details
- Historical comparisons highlight long-term growth patterns
Essential Marketing Metrics to Monitor in Your Management Dashboard
Data-driven decisions separate thriving brands from stagnant ones. Tracking the right key marketing metrics reveals what works, what drains budgets, and where opportunities hide. Teams that master this focus outperform competitors by 33% in ROI.
Campaign Performance Metrics
Every dollar spent demands accountability. Monitor link clicks, conversions, and cost-per-click to gauge tactical effectiveness. For example, a 2% CTR might indicate strong ad copy, while rising CPCs could signal bidding wars. Conversion value versus spend shows which efforts generate profit versus those needing adjustments.
Prioritize metrics that map to business goals. E-commerce teams track sales per channel, while lead-gen firms measure form submissions. Tools like media-specific CRM platforms automate this analysis, freeing teams to act on insights rather than compile reports.
Channel and Landing Page Analysis
Not all traffic converts equally. Compare organic search against paid ads to identify undervalued channels. Direct traffic often signals brand loyalty, while referrals hint at partnership potential. One SaaS company reallocated 40% of its budget to LinkedIn after discovering 3x higher conversions there.
Landing pages make or break campaigns. Track bounce rates and session durations to spot friction points. A/B test elements like headlines or CTAs—top performers often see 15-20% lift. Combine these insights with cost efficiency metrics like ROAS to build unstoppable funnels.
| Metric Type | Optimization Focus | Typical Impact |
|---|---|---|
| Click-Through Rate | Ad Relevance | +22% Engagement |
| Bounce Rate | Page Experience | -18% Drop-offs |
| Customer Lifetime Value | Retention Strategies | +35% Revenue |
Optimizing Data Sources and Integrations
Accurate insights require synchronized data streams from every marketing touchpoint. Modern solutions connect over 80 platforms—from Google Analytics 4 to TikTok—eliminating fragmented reporting. This consolidation turns scattered metrics into actionable intelligence.
Connecting Digital Marketing Tools
Leading platforms integrate with search engines, social networks, and analytics tools. SEMrush and Ahrefs feed SEO rankings into dashboards alongside Facebook ad conversions. Email services like Klaviyo sync subscriber behavior with website interactions for full-funnel analysis.
Call tracking systems like CallRail merge phone leads with digital campaigns. “These integrations reveal which channels drive actual sales, not just clicks,” notes a marketing director at a 300-client agency. Real-time connections help teams:
- Compare Google Ads performance against LinkedIn content
- Track Instagram Stories’ impact on e-commerce sales
- Alert managers when YouTube engagement drops
Using Custom Data Sources
Businesses enhance reports with proprietary data sources. Google Sheets imports internal sales figures, while custom APIs pull CRM data. This flexibility blends first-party insights with platform metrics for deeper analysis.
Adaptable systems future-proof marketing stacks. When Pinterest and TikTok launched ad APIs, early adopters gained competitive edges. Teams now combine Shopify order histories with Google Business Profile reviews to refine local strategies.
| Integration Type | Common Platforms | Strategic Value |
|---|---|---|
| Paid Ads | Google Ads, Meta | Cross-channel ROAS tracking |
| SEO | Ahrefs, Moz | Keyword gap identification |
| Custom | Sheets, APIs | Business-specific KPI alignment |
Customizing Your Dashboard with White Label Options
Branding transforms tools into strategic assets. White label solutions let agencies embed their identity into every client interaction, turning generic analytics into branded experiences. This approach strengthens credibility while delivering tailored insights.
Branding and Custom Themes
Teams can replace standard URLs with domains like reports.agencyname.com, creating seamless brand continuity. Color palettes and logos align dashboards with corporate guidelines, removing all third-party vendor marks. One agency increased client retention by 27% after implementing custom themes that mirrored their visual identity.
Advanced platforms allow dual customization—agencies apply their branding while clients see their own colors and fonts. This flexibility proves particularly valuable for firms managing multiple accounts. As a digital strategy lead notes: “White labeling lets us present unified insights without distracting clients with external tool branding.”
Personalized Layouts for Client Reporting
Tailored interfaces highlight metrics that matter most to each business. A retail client might see sales-per-channel widgets upfront, while a B2B firm prioritizes lead conversion pipelines. Users rearrange modules via drag-and-drop editors, ensuring reports align with unique objectives.
Custom email addresses for automated deliveries (reports@yourcompany.com) further reinforce professionalism. Agencies also define client-specific benchmarks, comparing performance against industry averages or past results. These adjustments turn generic data streams into actionable narratives that drive decisions.
| Standard Feature | White Label Upgrade | Impact |
|---|---|---|
| Shared link: platform.com/report | Branded URL: insights.clientdomain.com | +41% click-through rates |
| Vendor logo in header | Agency branding package | 32% faster client approvals |
| Generic metrics | Industry-specific KPIs | 28% higher relevance scores |
Boosting Campaign Performance with Key KPIs
Every marketing dollar demands accountability through measurable results. Teams that master key performance indicators unlock insights connecting activities to revenue. These metrics reveal which efforts drive purchases, sign-ups, or other critical actions.
Defining and Tracking Conversions
Marketing goal completions show how often visitors take desired actions. For example, tracking checkout page visits versus actual sales highlights funnel drop-offs. Monitoring cost per click (CPC) helps teams spot overpriced ads, while click-through rates (CTR) gauge audience relevance.
| Metric | Purpose | Typical Benchmark |
|---|---|---|
| Goal Completions | Measures desired actions | 5-10% conversion rate |
| CPC | Evaluates ad cost efficiency | $2.50 (industry avg) |
| CTR | Assesses engagement quality | 1.5-3% across channels |
Measuring ROI and Cost Efficiency
Return on ad spend (ROAS) compares revenue generated to advertising costs. Teams achieving $4 ROAS for every $1 spent outperform peers by 22%. Cost per acquisition (CPA) analysis identifies high-performing audiences, enabling smarter budget shifts.
Advanced performance indicators like customer lifetime value (CLV) reveal long-term profitability. One e-commerce brand redirected 30% of its budget to repeat buyers after discovering their CLV was 3x higher than new customers.
“Metrics without context are just numbers,” notes a growth strategist at a 200-client firm. “The right KPIs turn data into strategic roadmaps.”
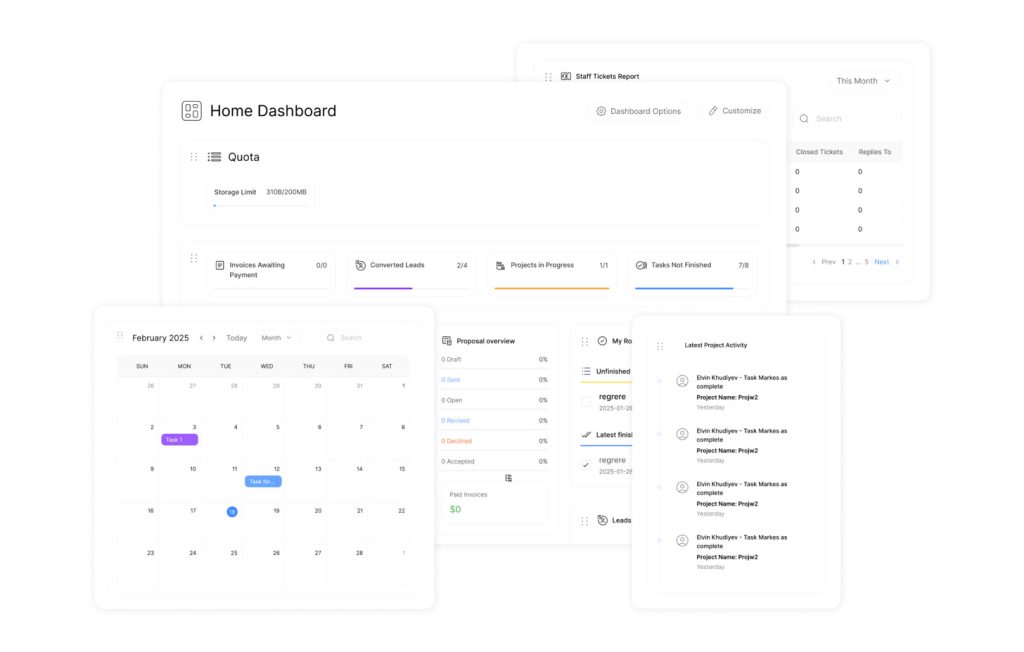
Streamlining Campaign Management Processes with a Management Dashboard
Modern marketing teams face a critical challenge: transforming data chaos into actionable insights. Organizations using advanced tools report cutting monthly reporting hours by 50% while improving accuracy—proof that streamlined processes drive real results.
Automation and Data Aggregation
Automation slashes manual reporting time from 30-40 hours monthly to just 10-20, as one enterprise team demonstrated. These tools pull cross-channel metrics into a unified dashboard, turning fragmented numbers into coherent performance stories.
These systems automatically aggregate data from search, social, and email platforms. Manual compilation errors vanish while teams gain capacity for analysis. Centralized tracking spots trends faster, letting marketers reallocate budgets mid-campaign.
Instant alerts notify teams about performance shifts or optimization opportunities. Scheduled reports ensure stakeholders receive updates without manual intervention—a feature saving one agency 22 hours monthly.
By eliminating manual tasks, professionals focus on strategic marketing priorities like audience targeting and creative testing. One agency reclaimed 300+ hours annually—time previously lost to spreadsheet management—while boosting client satisfaction through transparent reporting.