

 Return to
 Mastering Sales Performance Analytics: The Ultimate Guide

Sales Performance Analytics provides clear insights into revenue trends, team effectiveness, and growth opportunities, helping you make smarter decisions faster. In today’s fast-paced markets, businesses need more than intuition to drive growth. Data-driven strategies now separate industry leaders from competitors. By leveraging modern tools, organizations can transform raw numbers into actionable insights that fuel revenue and operational efficiency.
Traditional approaches often lead to missed opportunities and stagnant results. Common challenges include inconsistent forecasting, inefficient resource use, and unclear team productivity metrics. Advanced analytics combine historical trends with predictive modeling to close these gaps and enable smarter decisions.
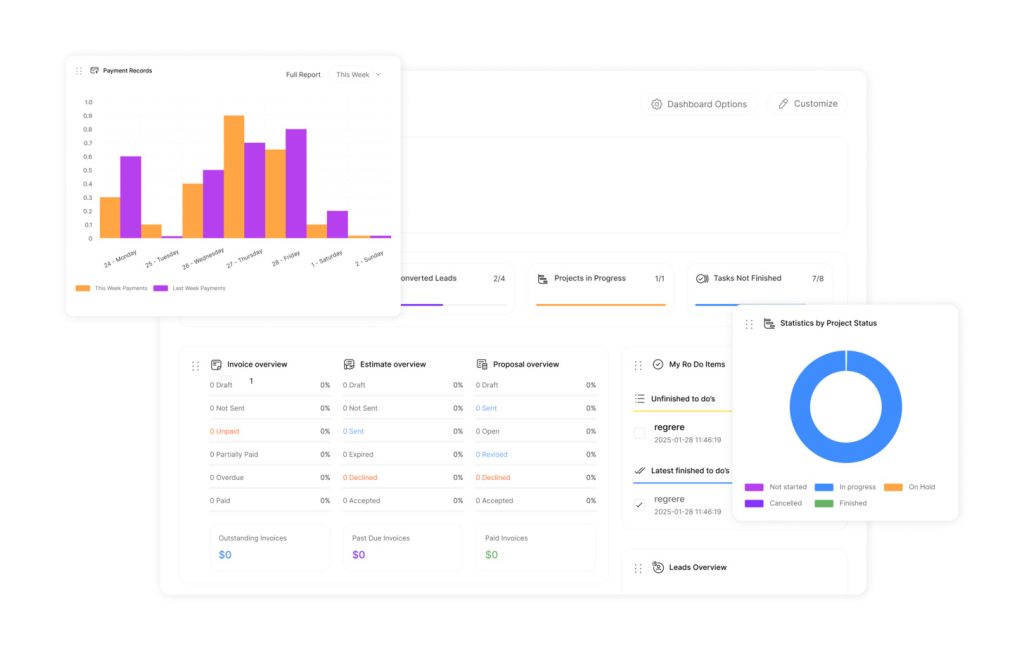
Real-time monitoring systems provide immediate visibility into pipeline health and conversion rates. This empowers managers to adjust tactics swiftly, allocate budgets effectively, and identify training needs. When implemented strategically, these practices create a continuous improvement cycle across departments.
Sales Performance Analytics: clear insights to boost revenue, optimize teams, and drive consistent growth.
- Transition from guesswork to evidence-based strategies using modern data tools
- Resolve forecasting errors through predictive modeling and trend analysis
- Optimize team productivity with real-time metrics and targeted coaching
- Align budget allocation with high-impact opportunities using historical benchmarks
- Build adaptable strategies that respond to shifting market conditions
Understanding Sales Performance Analytics
Modern business strategies thrive on precision. Companies now depend on systematic approaches to decode patterns hidden within operational data. This shift transforms how teams identify opportunities and refine their workflows.
Definition and Scope
Sales performance analytics converts raw metrics into strategic roadmaps. It evaluates every customer journey stage—from lead generation to deal closure—tracking revenue, pipeline efficiency, team output, and forecasting accuracy. By leveraging these insights, businesses can identify areas for improvement and implement targeted strategies to enhance their sales initiatives. Additionally, integrating sales process automation benefits streamlines operations, minimizes manual errors, and allows sales teams to focus on building relationships rather than administrative tasks. Ultimately, the blend of analytics and automation drives improved performance and revenue growth. By leveraging sales reporting best practices, organizations can better identify trends and anomalies that may impact their sales strategy. This systematic approach not only enhances transparency but also fosters a culture of accountability within the sales team. Ultimately, it empowers decision-makers to align resources effectively and drive sustained growth.
Advanced tools merge CRM data with market trends to create multi-layered insights. For example, analyzing conversion rates alongside competitor activity reveals gaps in outreach strategies, guiding budget decisions and training priorities without guesswork.
Importance in Modern Sales
Data-driven cultures outpace competitors by anticipating market shifts. A 2023 study found organizations using performance analytics reduced decision latency by 41%. Real-time dashboards highlight bottlenecks before they impact revenue, enabling rapid corrections.
Teams align daily activities with quarterly targets through measurable benchmarks, ensuring resources focus on high-impact initiatives. As one industry expert states, “Visibility into operational metrics builds accountability and agility simultaneously.”
Sales Performance Analytics: track sales, measure team performance, and drive growth.

Shifting from retrospective reviews to predictive models, modern data analysis drives proactive strategies. Early approaches relied on manual processes that delayed decision-making. Teams wasted hours compiling spreadsheets instead of capitalizing on opportunities.
Three pivotal changes define this transformation:
Historical Trends and Shifts
Before digital tools, organizations depended on error-prone spreadsheet methods. These systems generated outdated insights, often missing critical trends. Monthly reports provided little value for future planning.
Overall, the 2010s introduced CRM platforms that automated information gathering. This shift minimized manual errors and enabled weekly efficiency reviews. Managers gained real-time visibility into pipeline health for faster adjustments.
Advanced analytics platforms later incorporated machine learning algorithms. Real-time processing allowed teams to forecast outcomes rather than document past results. Automated alerts identified risks before they impacted revenue.
Cloud-based solutions democratized access to metrics across regions. Remote collaborators could review trends simultaneously, ensuring consistent standards. Instant updates replaced delayed quarterly assessments.
Modern systems now merge sales data with marketing and financial indicators. This integration creates a 360-degree view for strategic decisions. A 2024 industry report emphasizes: “Unified platforms reduce blind spots by 57% compared to siloed tools.”
These innovations empower leaders to anticipate market changes. By combining historical patterns with AI-driven insights, businesses maintain agility while scaling operations effectively.
Sales Performance Analytics: track sales, measure team performance, identify opportunities, and drive sustainable growth.
Organizations that harness data effectively unlock measurable advantages in competitive markets. Systematic evaluation transforms operational insights into strategic fuel, driving growth while minimizing guesswork. This approach creates ripple effects across revenue streams, team dynamics, and customer relationships.
Boosting Revenue Efficiency
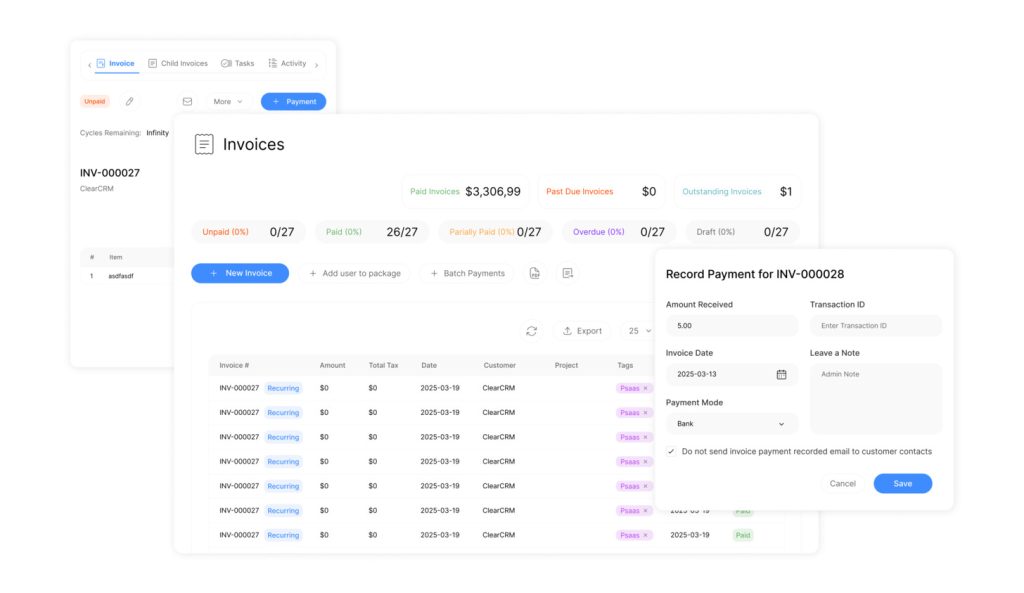
Resource optimization becomes precise when teams identify high-impact activities. By tracking conversion patterns, businesses reallocate budgets to top-performing channels. A 2024 study showed companies using advanced CRM solutions reduced wasteful spending by 38% within six months.
Eliminating low-yield processes preserves profitability. Real-time dashboards highlight underperforming campaigns, enabling swift adjustments. Leaders gain clarity on which strategies deliver exponential returns versus diminishing ones.
Improving Team Effectiveness
Data reveals individual strengths and skill gaps objectively. Managers craft personalized coaching plans using engagement metrics and deal closure rates. Teams using performance benchmarks see 27% faster onboarding, according to recent industry reports.
Accountability frameworks motivate consistent output. Recognition programs tied to measurable outcomes boost morale while aligning efforts with organizational goals. One sales director noted: “Clear metrics transformed our culture from reactive to proactively ambitious.”
Identifying and Addressing Pipeline Bottlenecks
Every stalled deal erodes revenue potential. Teams using systematic sales performance analysis uncover hidden leaks in their workflows. Consider a company with 1,000 quarterly opportunities: a 10% drop in demo-to-proposal conversions slashes $200K per quarter. Over a year, that gap balloons to $800K.
Analyzing Conversion Rates
Conversion rate optimization starts with stage-by-stage diagnostics. Mapping the sales funnel reveals where prospects disengage. For example, a decline from 40% to 30% at the proposal stage signals misaligned messaging or pricing objections.
Granular tracking exposes patterns. Are specific reps struggling with technical demos? Do certain industries hesitate post-proposal? “Data illuminates root causes, not just symptoms,” notes a revenue operations leader. Targeted coaching based on these insights often lifts conversions within weeks.
Streamlining the Sales Process
Eliminating friction accelerates deal velocity. Audit each step in the sales cycle:
- Automate repetitive tasks like follow-up emails
- Simplify proposal templates to reduce review cycles
- Align marketing collateral with common buyer questions
Boost results with Sales Performance Analytics—clear insights that help you track revenue, optimize teams, and drive smarter growth. One SaaS firm reduced their sales cycle by 18 days after removing redundant approval layers. Real-time dashboards now flag aging deals, enabling timely interventions. This approach turns pipelines into growth engines rather than constraint points.
Optimizing Sales Forecasting with Predictive Analytics

Accurate forecasting separates thriving businesses from those stuck reacting to market shifts. Predictive tools eliminate guesswork by transforming raw numbers into strategic roadmaps. These systems analyze patterns across timeframes and variables, empowering teams to anticipate outcomes rather than document past results.
Sales Performance Analytics: clear insights to boost revenue and growth.
Machine learning algorithms process decades of historical data in minutes. They detect subtle correlations between seasonal trends, customer behavior, and market conditions. One logistics firm reduced forecasting errors by 62% after implementing AI models that adjust for weather patterns and fuel costs.
Modern platforms merge pipeline metrics with external factors like competitor activity. This creates dynamic projections updated in real time. As deals progress or stall, forecasts automatically recalibrate. A 2024 Gartner report states: “Organizations using predictive analysis achieve 89% higher forecast accuracy than peers relying on spreadsheets.”
Risk assessment features flag potential revenue shortfalls weeks in advance. Teams receive alerts about deals at risk of delay or cancellation. This enables proactive interventions like revised incentives or accelerated approvals. Integration with CRM automation tools ensures forecasts reflect live pipeline changes.
Cross-departmental data unification strengthens predictions further. Marketing campaign results and customer support metrics feed into models, revealing hidden influences on buying cycles. These insights help align budgets with high-probability opportunities while minimizing wasteful spending.
Measuring Essential Sales Metrics
Effective decision-making relies on tracking the right indicators. Two metrics stand out for their ability to reveal operational health and growth potential. These measurements help teams refine strategies while maintaining financial discipline.
Tracking Cycle Duration
Cycle length measures how long deals take to close. Shorter cycles mean faster revenue generation and better cash flow. Teams identify bottlenecks by analyzing stage transitions. For example, delayed approvals might extend timelines by 12-18 days.
Importantly, optimization strategies include automating follow-ups and simplifying contract reviews. One tech firm reduced their average cycle by 21% after mapping friction points in discovery calls.
Monitoring Acquisition Expenses
Customer acquisition cost (CAC) calculates marketing and outreach spend per new client. Lower CAC indicates efficient resource use. A 2024 survey found companies with CAC tracking achieve 34% higher profit margins than peers.
Next, effective management involves comparing channel returns. Paid ads might cost $150 per lead, while referrals average $75. “Visibility into spending patterns prevents budget leaks,” notes a growth strategist.
| Metric | Impact | Optimization Strategy |
|---|---|---|
| Cycle Length | Revenue velocity | Automate repetitive tasks |
| CAC | Profitability | Prioritize high-ROI channels |
| Win Rate | Pipeline efficiency | Improve proposal alignment |
Regular benchmarking against industry standards highlights improvement areas. Ultimately, combining quantitative data with customer feedback creates actionable roadmaps for sustainable growth.
Using CRM and Sales Analytics Tools
Strategic tools shape how teams convert information into revenue. Leading CRM systems like HubSpot track customer interactions and pipeline stages but often miss real-time insights. Thus, specialized platforms fill this gap by merging foundational data with predictive capabilities.
Overview of Leading Platforms
CRM software organizes client histories and deal progress. While effective for basic tracking, these systems struggle with dynamic forecasting. Third-party tools like Forecastio add layers of AI-powered analysis, assessing risks and highlighting trends hidden in raw numbers.
Yet, it helps you identify top performers, find improvement areas, and make fast, data-driven decisions that boost sales and profitability. Integration connects CRM data with marketing systems and customer feedback. This creates unified dashboards showing campaign impacts and team productivity. Marketing automation integration, for example, reveals which leads convert fastest after email engagements.
Enhancing Forecast Accuracy
Advanced algorithms analyze years of data in minutes. Therefore, they weigh seasonal trends, economic shifts, and competitor moves to predict outcomes. One platform reduced forecasting errors by 58% for a retail client by adjusting for holiday demand spikes.
Consequently, custom dashboards highlight urgent deals needing attention. Automated alerts notify managers about slipping timelines or budget overruns. Teams act faster, preserving margins while maintaining service quality.
| Platform Type | Key Features | Business Impact |
|---|---|---|
| Core CRM | Contact management, pipeline tracking | Centralized data storage |
| Analytics Add-ons | AI forecasting, risk alerts | 22-35% faster decision-making |
| Integrated Systems | Cross-department data merging | 18% higher forecast accuracy |
Sales Performance Analytics: track sales, optimize teams, and drive growth.
Additionally, Sales Performance Analytics delivers clear insights into revenue trends, team productivity, customer behavior, and overall business growth. Also, businesses convert raw information into measurable results by aligning strategy with evidence-based methods. So, effective execution requires frameworks that bridge analysis and execution, ensuring insights directly influence daily operations.
Translating Insights into Action
However, structured decision-making processes turn patterns into priorities. Teams using visual dashboards identify high-impact initiatives 43% faster than those relying on static reports. For example, color-coded funnel metrics highlight stalled deals needing immediate attention.
Similarly, simplified communication tools ensure alignment. Interactive charts replace dense spreadsheets, helping teams grasp next steps without technical expertise. One retail chain reduced training time by 31% after adopting visual workflow guides.
Implementing Real-Time Data Solutions
Likewise, dynamic systems enable swift responses to market shifts. Automated alerts notify managers about slipping conversion rates or budget overruns. “Proactive adjustments preserve margins better than quarterly reviews,” observes a revenue operations director.
Cloud-based platforms unify cross-departmental metrics for cohesive strategies. Live dashboards track campaign impacts alongside team productivity, eliminating data silos. Clearly, this integration helps organizations reallocate resources within hours rather than weeks.