

 Return to
 The Ultimate Guide to Effective Goals And KPI Monitoring
Goals and KPI Monitoring helps businesses track performance against strategic objectives. In today’s fast-paced business environment, quantifiable metrics distinguish thriving organizations from stagnant ones. Key Performance Indicators (KPIs) act as navigational tools, translating abstract objectives into measurable outcomes. These metrics empower teams to uncover growth opportunities, optimize workflows, and align daily actions with long-term vision.
Forward-thinking companies leverage performance tracking to bridge strategy and execution. By analyzing both predictive and historical data, leaders gain a 360-degree view of organizational health. This approach transforms raw numbers into actionable insights, enabling swift adjustments in resource allocation and priority-setting.
The most successful enterprises treat their measurement frameworks as living systems. They combine real-time dashboards with periodic reviews, fostering a culture of accountability where every contribution directly supports overarching targets.
Modern tools have revolutionized data interpretation. Advanced platforms aggregate multiple data streams into unified interfaces, eliminating guesswork from strategic planning. This integration helps decision-makers spot trends faster and respond with precision-driven initiatives.
Key Takeaways
- KPIs convert business objectives into trackable metrics for measurable progress
- Balancing leading and lagging indicators provides comprehensive performance insights
- Real-time data visualization enhances strategic agility across departments
- Effective tracking systems foster organizational alignment and accountability
- Integrated technology platforms simplify complex data analysis for faster decisions
Mastering Goals And KPI Monitoring: An Overview
Effective management hinges on translating vision into trackable results. Performance indicators act as compass points, guiding teams through complex operational landscapes while ensuring alignment with strategic priorities.
Understanding the Core Concepts
At its foundation, performance measurement distinguishes between routine metrics and mission-critical indicators. As Forbes notes:
“The difference between a metric and a KPI lies in its strategic impact – one tracks activity, the other drives decisions.”
Three principles define successful systems:
- Quantifiable measurement: Converting abstract objectives into numerical benchmarks
- Strategic alignment: Linking metrics directly to business priorities
- Systematic tracking: Establishing consistent review cycles for continuous improvement
Why It Matters for Your Business
Organizations using structured monitoring frameworks report 23% faster decision-making cycles according to Harvard Business Review. This approach eliminates ambiguity in three key areas:
1. Operational transparency reveals inefficiencies in real time
2. Data-driven accountability aligns team efforts
3. Predictive insights enable proactive strategy adjustments
Companies prioritizing these systems often outperform competitors in customer retention (+18%) and profit margins (+14%). The right indicators transform scattered data points into coherent success roadmaps.
Defining Effective Business Goals
Strategic clarity begins with well-defined business aims that drive measurable outcomes. Companies excelling in this area create frameworks where every target directly contributes to operational excellence and market relevance.
Setting Clear and Measurable Objectives
High-performing teams convert abstract ideas into numerical benchmarks. A retail chain, for example, might transform “improve customer satisfaction” into “increase survey scores by 15% within six months.” This precision eliminates guesswork and enables progress tracking.
| Approach | Impact | Timeframe |
|---|---|---|
| SMART Targets | 27% faster achievement | 6-12 months |
| Hierarchical Goals | 42% better alignment | Ongoing |
| Quantified Metrics | 33% fewer errors | Quarterly |
Aligning Goals With Organizational Vision
Top-tier enterprises design cascading targets that connect daily tasks to long-term aspirations. When a tech firm’s five-year market leadership plan translates into quarterly R&D milestones, teams maintain focus on strategic priorities. This cohesion prevents resource drain on low-impact activities.
Regular audits ensure targets remain relevant. A Harvard study found companies reviewing objectives quarterly achieve 19% higher success rates than annual planners. These checkpoints allow course corrections while preserving alignment with core mission statements.
What are Key Performance Indicators?
Navigating business success requires distinguishing between vital signs and routine checkups. Performance measurement systems thrive when organizations prioritize strategic indicators over generic data points. This distinction separates meaningful progress tracking from operational noise.
KPIs vs. Metrics: Understanding the Differences
As Gartner analysts observe:
“The brightest companies treat their performance data like a medical chart – critical indicators demand immediate attention, while routine metrics inform ongoing care.”
Three characteristics define true indicators:
- Strategic alignment: Direct ties to organizational priorities
- Decision-driving power: Influences resource allocation
- Outcome focus: Measures business impact, not activity volume
Consider this comparison:
| Element | KPIs | Metrics |
|---|---|---|
| Purpose | Track strategic outcomes | Monitor daily operations |
| Frequency | Quarterly reviews | Real-time tracking |
| Ownership | Executive team | Department leads |
Leading enterprises allocate 73% of their analysis time to indicators rather than general metrics. This focus helps teams:
- Identify market shifts faster
- Optimize budget distribution
- Measure true competitive advantage
Effective systems evolve with business needs. Regular audits ensure indicators remain tied to current objectives rather than historical priorities. Companies that master this balance report 31% higher stakeholder satisfaction than industry peers.
Implementing KPI Monitoring Systems
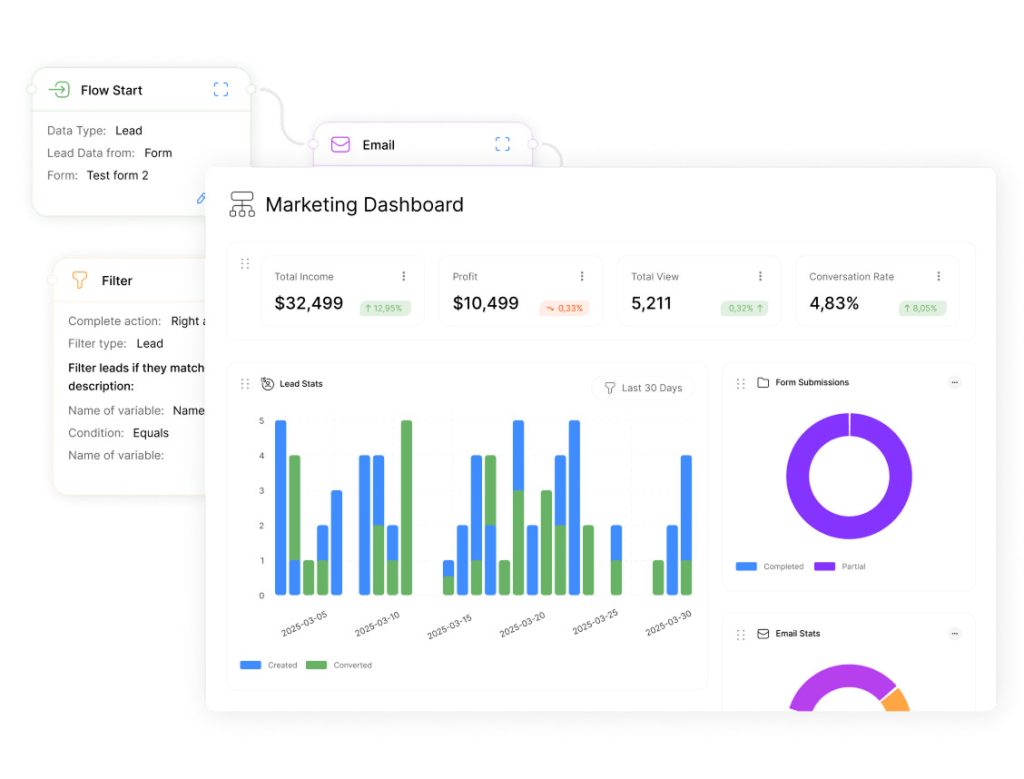
Modern enterprises thrive through dynamic data visualization. Centralized dashboards transform scattered metrics into strategic roadmaps, enabling leaders to assess organizational health instantly. A Forrester study reveals:
“Companies using visual tracking tools achieve 34% faster course corrections than those relying on spreadsheets.”
Building Impactful Tracking Interfaces
Effective dashboards prioritize clarity over complexity. Start by selecting 5-7 mission-critical metrics that reflect core objectives. Use color-coded progress bars and trend lines to depict real-time status updates. Top platforms like Tableau and Power BI offer drag-and-drop functionality, letting teams create custom views without coding expertise.
Three principles ensure successful implementation:
- User-centric design: Tailor displays to decision-makers’ needs
- Progressive disclosure: Layer details behind summary views
- Cross-platform access: Ensure mobile/desktop compatibility
Harnessing Live Information Streams
Real-time integration eliminates outdated snapshots of business health. Cloud-based systems now sync with CRM tools, financial software, and IoT devices automatically. This live connectivity helps teams:
- Spot sales pipeline changes during quarterly pushes
- Adjust inventory levels as demand fluctuates
- Redirect resources to high-priority initiatives
For example, automated alerts maintain focus on critical thresholds. When customer satisfaction scores dip below 80%, management receives instant notifications. This proactive approach reduces response times by 41% compared to manual checks.
Scalability remains essential as companies evolve. Modular architectures let organizations add new data sources without overhauling existing systems. Regular usability testing ensures interfaces remain intuitive as tracking needs grow more sophisticated.
Strategies to Align Goals with KPIs
Strategic success demands frameworks that bridge aspirations with measurable outcomes. Two proven methodologies—SMART criteria and the 6 A’s—create disciplined approaches for connecting business priorities with trackable results.
Designing Precision-Driven Targets
The SMART framework transforms vague intentions into clear benchmarks. A Specific objective like “Increase subscription renewals by 12% in Q3” eliminates ambiguity. Measurable parameters enable progress tracking, while Attainable thresholds prevent unrealistic expectations.
Complementing this approach, the 6 A’s method adds layers of strategic rigor:
- Aligned: Direct ties to organizational priorities
- Acute: Clear cause-effect relationships
- Alive: Regular updates reflecting market shifts
Top financial institutions combine these models to create targets that balance ambition with practicality. As one Fortune 500 CFO noted:
“Our 6 A’s review process catches misaligned indicators before they distort resource allocation.”
Three practices maintain cohesion between planning and execution:
- Quarterly cross-departmental alignment workshops
- Automated tracking of target relevance scores
- Dynamic threshold adjustments based on market data
These systems help teams visualize how daily tasks contribute to annual objectives. Retail chains using dual frameworks report 28% faster target achievement than peers relying on single methodologies. Regular calibration ensures metrics evolve with business needs rather than becoming outdated relics.
Categorizing KPIs: Strategic, Operational, and Functional
Hierarchical measurement frameworks transform data chaos into strategic clarity. Organizations achieve precision by sorting indicators into three tiers: strategic pillars for executives, operational lenses for department leads, and functional tools for specialized teams. Because of this, this structure ensures decision-makers access relevant insights without drowning in unrelated metrics.
| Type | Focus | Users |
|---|---|---|
| Strategic | Market share, profit margins | C-suite executives |
| Operational | Process efficiency | Department managers |
| Functional | Specialized activities | Team leads |
Department-Specific Measurement Models
Marketing teams track campaign success through return on ad spend and social media engagement rates. These functional indicators reveal which channels drive conversions. For instance, a 20% click-through rate on email campaigns signals stronger audience resonance than broad reach metrics.
On the other hand, sales managers prioritize pipeline velocity and customer acquisition costs. A software company might monitor monthly recurring revenue growth while tracking retention rates. This dual focus balances expansion with sustainability.
Operations specialists use metrics like inventory turnover ratios and production downtime percentages. For this reason, a manufacturing plant reducing equipment idle time by 15% directly improves output without capital investment. As McKinsey analysts observe:
“Granular operational data often reveals the fastest paths to margin improvement.”
These layered systems prevent information overload. Executives see profit trends, department heads optimize processes, and teams refine daily activities – all while maintaining alignment with organizational priorities.
Using Data to Set Realistic KPI Targets

Successful businesses ground their ambitions in hard numbers. Teams establish targets through rigorous analysis of past achievements and market realities. This approach prevents the frustration of chasing unattainable outcomes while maintaining motivational momentum.
Goals and KPI Tracking ensures sustainable growth.
Without a doubt, data analysis reveals patterns that shape achievable objectives. Historical performance metrics create baselines reflecting organizational capacity. For example, a company averaging 8% annual revenue growth would set a 12% target rather than 20% – challenging yet feasible.
| Focus Area | Data Sources | Review Frequency | Key Benefit |
|---|---|---|---|
| Internal Trends | Sales records, productivity reports | Monthly | Identifies organic growth potential |
| Market Position | Competitor analysis, industry reports | Quarterly | Highlights competitive advantages |
| Resource Capacity | Budget allocations, staffing levels | Bi-annual | Ensures target feasibility |
Above all, industry comparisons add crucial context. A retail chain might discover its 3-day delivery speed lags behind competitors’ 2-day averages. To be more specific, this insight helps set improvement targets that close gaps without overextending resources.
Three practices maintain target relevance:
- Blending internal metrics with sector-wide data
- Adjusting thresholds as market conditions shift
- Validating objectives through cross-department reviews
Organizations using this dual approach achieve 37% higher target completion rates. Regular calibration keeps expectations ambitious yet grounded in operational reality.
Monitoring Progress: Leading vs Lagging KPIs
Businesses steering toward success need both rearview mirrors and windshields. Leading and lagging indicators work together like navigational instruments, providing complete visibility into organizational momentum. This dual perspective helps teams maintain course corrections while accelerating toward milestones.
Understanding Leading Indicators
Not only that, predictive metrics act as early warning systems. Daily website traffic patterns or social media engagement rates forecast future sales pipelines. These forward-looking signals enable proactive strategy shifts – like adjusting marketing spend when content shares drop below thresholds.
Understanding Lagging Indicators
Let’s look at an example, historical data points validate past decisions. Monthly revenue figures or customer retention rates show cumulative results of previous actions. A software company might analyze quarterly churn rates to assess product improvement effectiveness. These measurements confirm whether tactical adjustments produced intended outcomes.
High-performing organizations balance both perspectives. What’s more, a retail chain tracking weekly foot traffic (leading) alongside quarterly sales growth (lagging) gains complete performance visibility. This approach connects immediate actions to long-term results, creating feedback loops for continuous improvement.
In fact, modern analytics platforms automatically correlate leading and lagging data streams. As a result, when email click-through rates dip, teams receive alerts before conversion metrics suffer. This real-time alignment helps maintain progress toward strategic targets while preserving resource efficiency.
FAQ
How do KPIs differ from general business metrics?
Goals and KPI Monitoring keeps teams aligned with business objectives.
What makes a KPI “SMART” in practice?
How can teams benchmark KPI targets effectively?
Which KPIs best indicate future performance in sales teams?
What operational KPIs do manufacturing firms monitor?
Additionally, in today’s fast-paced business environment, quantifiable metrics separate thriving organizations from stagnant ones. Finally, key performance indicators (KPIs) serve as navigational tools, translating abstract objectives into measurable outcomes. Also, these metrics empower teams to identify growth opportunities, optimize workflows, and align daily actions with long-term vision.
So, forward-thinking companies leverage performance tracking to bridge strategy and execution. However, by analyzing both predictive and historical data, leaders gain a 360-degree view of organizational health. Similarly, this approach transforms raw numbers into actionable insights, enabling swift adjustments in resource allocation and priority-setting.
Likewise, the most successful enterprises treat their measurement frameworks as living systems. Indeed, they combine real-time dashboards with periodic reviews, ensuring teams remain focused on high-impact activities. Clearly, when implemented correctly, these systems create a culture of accountability where every contribution directly links to overarching targets.
Undoubtedly, modern tools have revolutionized how businesses interpret critical data. Nevertheless, advanced platforms now aggregate multiple data streams into unified interfaces, eliminating guesswork from strategic planning. Still, this technological integration allows decision-makers to spot trends faster and respond with precision-driven initiatives. Yet, effective management hinges on translating vision into trackable results. Therefore, performance indicators act as compass points, guiding teams through complex operational landscapes while maintaining alignment with strategic priorities.